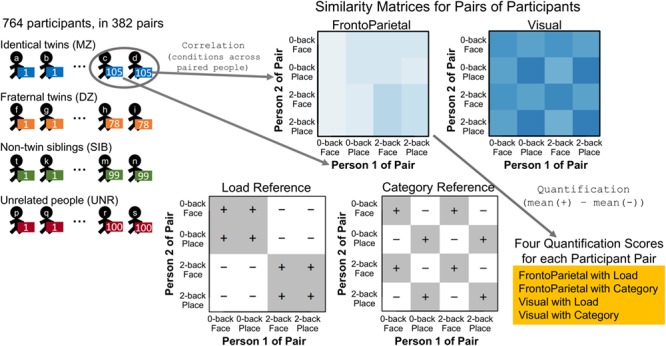
Figure 2.

Illustration of the method of quantifying similarity of paired participants. The imaging data (parameter estimates) for each participant were extracted for each of the four conditions and two communities, as in Figure 1. The similarity matrix for each participant pair was constructed as Pearson correlations of all possible condition combinations between the two participants (e.g., 2-back Place of Person 2 correlated with 2-back Face of Person 1). Note that, unlike the similarity matrices for each individual participant, these matrices are not symmetric, and the diagonal is not 1. Finally, the Load and Category information in each matrix was quantified by subtracting the average of the cells marked with − from the average of the cells marked with + in the Reference Matrices, resulting in four scores for each pair of participants.
