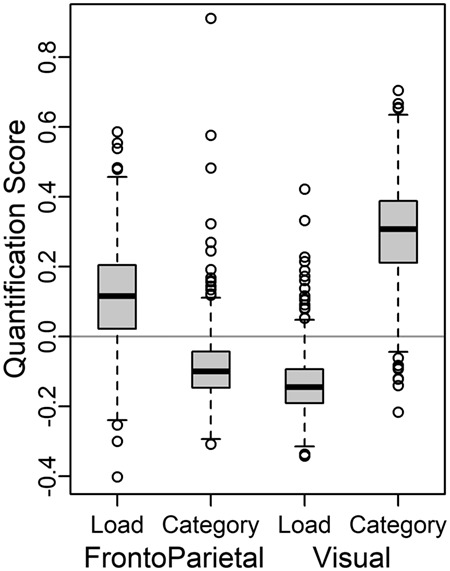
Figure 4.

Distribution of Load and Category quantification scores for individuals’ matrices, by community. The Load quantification scores tend to be higher than Category in FrontoParietal, but the reverse in Visual. Boxplots for participants by subject group are shown in Supplementary Material, Section S2.3.
