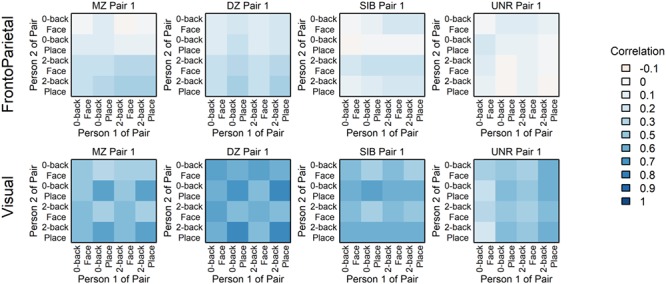
Figure 6.

Similarity matrices for the two communities in four paired people. More examples and the group averages are in Supplementary Material, Section S3.1. As in the Figure 3 matrices for individuals, these pairwise similarity matrices tend to resemble the Category Reference (Figure 2) when calculated from Visual activation patterns, but the Load when calculated in FrontoParietal. The resemblance and correlations are strongest in the MZ and DZ pairs, with little similarity seen in UNR FrontoParietal.
