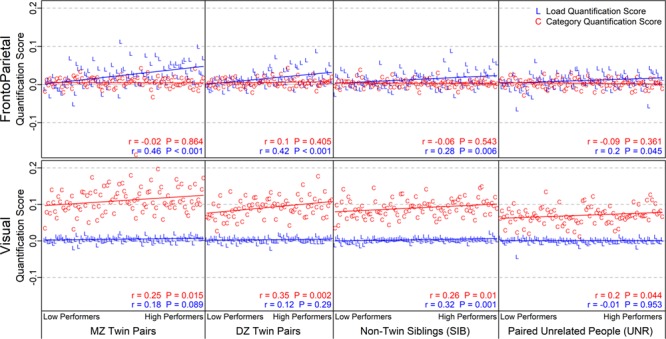
Figure 9.

Pairwise quantification scores, arranging participant pairs along the x-axis in order of increasing behavioral performance within each subject group (d′ averaged over the two participants; pairs with missing performance for either member omitted). The best performing pair is at the right of each subject group, so higher performance is associated with higher quantification scores. Listed r and p values are from correlating quantification scores against the behavioral performance rank ordering; Supplementary Material, Section S4.3 and the main text give correlations against the mean d′. Supplementary Material, Section S4.2 has versions of this figure unsorted by behavioral performance and with different Load quantification. Supplementary Material, Section S5.1c has this figure for a group of unrelated participants chosen to have similar behavioral performance.
