
Figure 5.
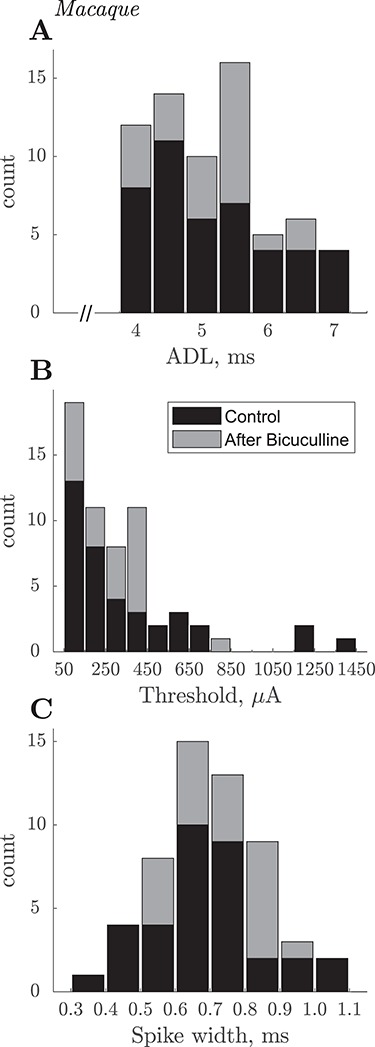
Macaque. Summary of slow PTN properties. (A) Stacked histograms of ADLs of 67 slow PTNs recorded in three macaques. Latencies were measured to the onset of the antidromic spike evoked by PT shocks with intensity of 1.2 × T. Black and gray bars indicate PTNs recorded, respectively, before and after intracortical biccuculine. Each bin is 0.5 ms wide and represents ADLs 0.25 before, and 0.25 after, the central tick-mark (i.e., for 4 ms it was ADLs falling between 3.75 ms and 4.25 ms). The latency range of these PTNs would correspond to CVs of ~12 to ~6 m/s, assuming a PT-M1 conduction distance of 47 mm and a utilization time of 0.1 ms. (B) Distribution of current thresholds for antidromic responses. Thresholds were determined in 61/67 cases. (C) Distribution of spike duration in 55 slow PTNs. Spike duration was measured from the negative trough to the positive peak of each average antidromic spike. Note that nearly all slow PTNs had broad spikes with durations >500 μs.