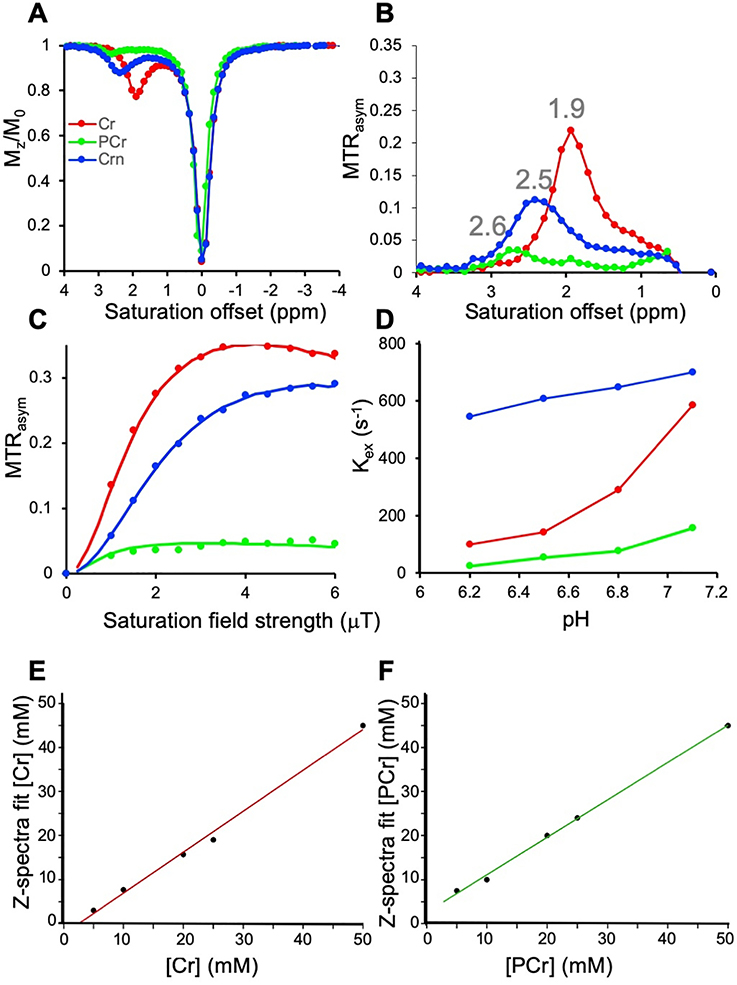
Figure 3.
In vitro phantom results. A) CEST Z-spectra and B) MTRasym of Cr, PCr and Crn using B1 = 1.5 μT; C) QUESP plots of Cr, PCr and Crn at pH 7.1 obtained with B1 = 1, 1.5, 2, 2.5, 3, 3.5, 4, 4.5, 5, 5.5 and 6 μT respectively; D) Exchange rate vs pH of Cr, PCr and Crn measured using Bloch simulation fitting the QUESP dataset; E) Correlation between spectral fit concentration and measured concentrations for [Cr] = 50, 25, 20, 10, 5 mM; F) Correlation between spectral fit concentration and measured concentrations for [PCr] = 50, 25, 20, 10, 5 mM; Conditions: 20 mM Cr, PCr, and Crn phantoms, T= 37 °C and pH values 6.2, 6.5, 6.8 and 7.1 were used for CEST experiments.

