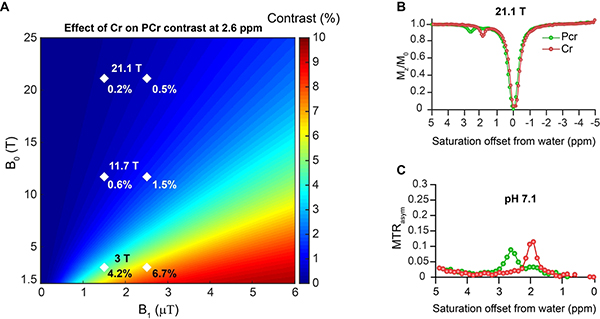
Figure 4.
Bloch simulations of Cr, PCr contrast and in vitro CEST experiments on phantoms at 21.1 T. A) Bloch simulations of increase in PCr contrast due to presence of the 1.9 ppm Cr peak at different B0 and B1 fields. Diamonds are shown at the critical values of B1 = 1.5 μT and 2.5 μT to indicate that the PCr CEST contrast at 2.6 ppm is increased by 4.2 %, 0.6% and 0.2% by overlap with 1.9 ppm Cr peak for B1 = 1.5 μT and to 6.7 %, 1.5% and 0.5% for B1 = 2.5 μT on 3, 11.7 and 21 T MRI scanners respectively. T1 and T2 relaxations were kept constant for simulations as mentioned in Table 2; B) 21.1 T CEST z-spectra and C) 21.1 T MTRasym spectra of Cr, PCr samples at pH 7.1, T=37 °C using 2.5 μT RF saturation.

