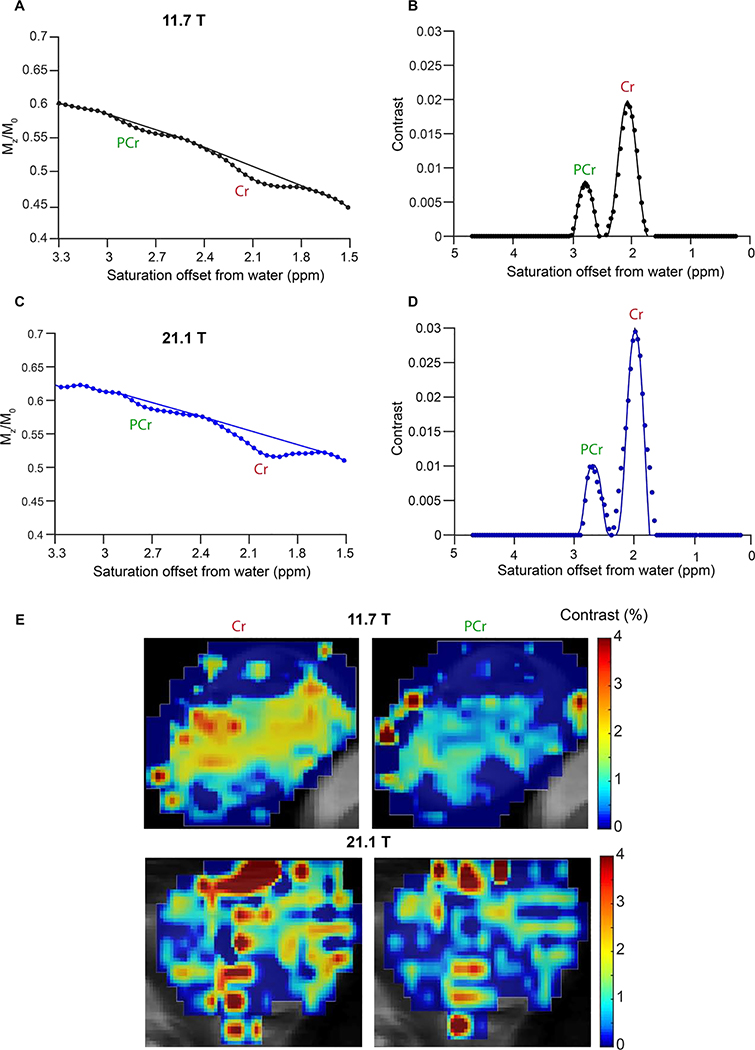
Figure 5.
Comparison between 11.7 T and 21.1 T muscle CEST contrast of Cr and PCr. A) Z-spectrum from an ROI drawn over the muscle of a mouse, CEST data was acquired at B1= 1.5 μT on 11.7 T scanner. A polynomial data generated by removing the CEST contrast was fit to separate the CEST contrast of Cr and PCr; B) The difference spectrum displayed between 0 and 5 ppm of saturation offsets. This difference spectrum was obtained by subtracting from the experimental Z-spectrum a 3rd order polynomial fit to the experimental spectrum minus the PCr and Cr peaks. to determine the Cr and PCr concentrations in mouse muscle which were 10.8 mM and 19.5 mM respectively; C) Z-spectrum from an ROI drawn over the muscle of a mouse with CEST data acquired at B1=1.5 μT on 21.1 T scanner; D) Difference spectrum obtained by subtracting from the experimental Z-spectrum a 3rd order polynomial fit to the experimental spectrum minus the PCr and Cr peaks. The concentrations of Cr and PCr in muscle were found to be 10.7 and 15.8 mM respectively based on Bloch simulation fittings of the 21.1 T data; E) 11.7 and 21.1 T CEST contrast maps at Cr and PCr frequencies for a single calf muscle.

