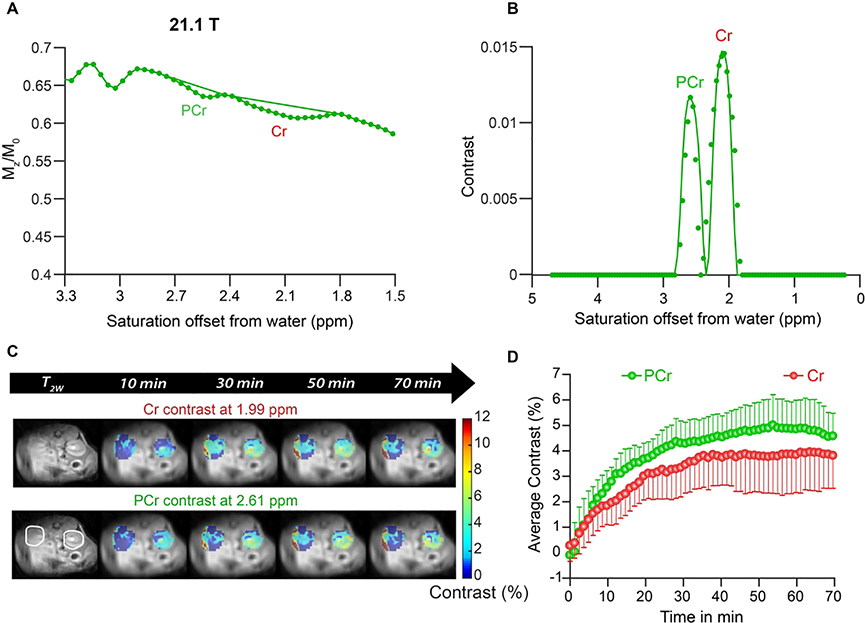
Figure 6.
In vivo kidney CEST experiments on 21.1 T scanner on mice. A) Z-spectrum and 3rd order polynomial prior to PCr injection for an ROI drawn over the cortex of the kidney which avoided the collecting system. Cr and PCr contrast can be seen clearly at 1.99 and 2.61 ppm respectively; B) The difference spectrum calculated by subtracting the experimental Z-spectrum and the polynomial with experimental data (symbols) and fit (solid lines) to obtain the in vivo Cr and PCr concentrations= 6 mM and 22.5 mM respectively; C) In vivo kidney dynamic CEST contrast images overlaid on high resolution T2W images at 21.1 T after administering 325 mM PCr. ST = 1-Mz/M0 at 1.9 and 2.6 ppm corresponds to Cr and PCr frequencies; D) Average CEST contrast of Cr and PCr after administering PCr to healthy mice [n=6] and acquiring in vivo CEST kidney data at 21.1 T. Both Cr and PCr uptake peaked between 20 and 40 min.

