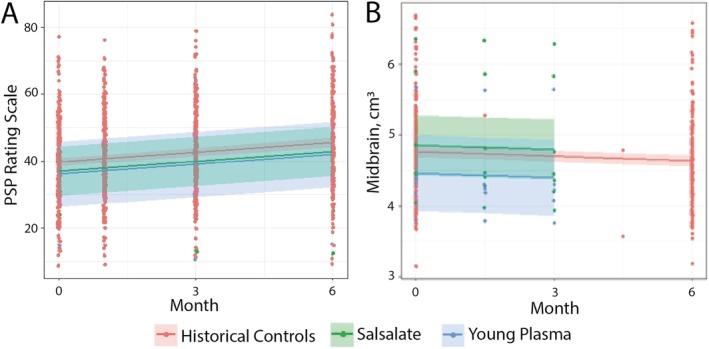
Figure 2.

Progression on PSPRS and rate of midbrain atrophy did not differ between trial groups and historical controls. Lines represent linear mixed‐effect regression over time in each cohort, with the shaded area representing 95% confidence intervals around the calculated mean. Trial data (salsalate and YP) are compared to available historical control data. At baseline, PSPRS and midbrain volume were not different between trial cohorts or historical controls, and no difference was found in (A) progression on PSPRS or (B) atrophy of midbrain between the three groups, though the large confidence intervals attributable to small sample size should be noted.
