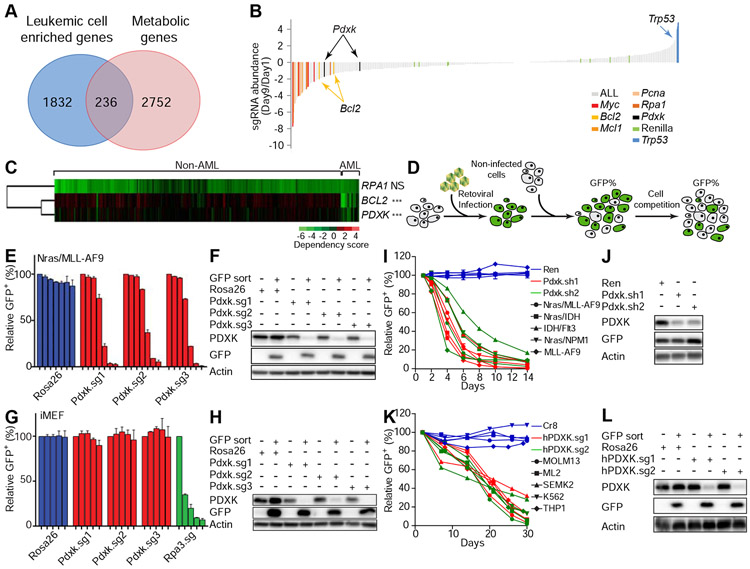
Figure 1. CRISPR/Cas9 functional genomics screen identifies pyridoxal kinase as a selective leukemia dependency.
(A) Schematic showing the numbers of metabolic genes enriched in AML leukemic cells. Among 2752 metabolic genes analyzed, 236 genes were enriched in AML leukemic cells in comparison to normal hematopoietic stem and progenitor cells. (B) Nras(G12D)/MLL–AF9 leukemic cells were infected with viral sgRNA pool. The ratios of integrated sgRNA reads on day 9 over day 1 are shown. (C) The dependency of indicated cell lines on listed genes was analyzed from previously published data (Rauscher et al., 2017; Wang et al., 2017). Each row represents a gene, while each column represents a cell line. AML or non-AML cell lines are denoted on the top panel. Gene dependency score was calculated by taking the average of Log2FC (abundance fold-change) of all corresponding sgRNAs. This average Log2FC number was color-coded. Green represents depletion, black represents no change, and red represents an enrichment of indicated cell lines. Un-supervised clustering was used to cluster genes or experiments with similar phenotypes. ’NS’ represents no statistical significance and ‘***’represents p<0.001 of Wilcox test. (D) Schematic diagram showing the in vitro competition assay. (E-H) Nras(G12D)/MLL-AF9 leukemic cells (E and F) or iMEF cells (G and H) were infected with viruses encoding indicated sgRNAs. The percentage of GFP+ infected cells were counted on day 2, 4, 6, 8, 10, 12 and 14 (E) or on day 2, 7, 13, 18 and 24 (G). The individual bar in histograms represents the GFP+ percentage on each day. Data are presented as average and standard deviation (SD) (n=2). Western blot analysis showing the expression levels of PDXK in sorted GFP+ and GFP− cells (F and H). (I-L) Indicated mouse (I and J) or human (K and L) leukemic cell lines were infected with viruses encoding indicated shRNAs/sgRNAs. The percentage of GFP+ infected cells were counted from day 1 to 14 (I) or day 2 to 30 (K). Western blot was performed to measure the expression levels of PDXK in mouse Nras(G12D)/MLL-AF9 cells (J) and human MOLM13 cells (L). The average and SD of relative GFP+ percentage are shown (n=2). See also Figure S1-S3 and Table S1-S4.

