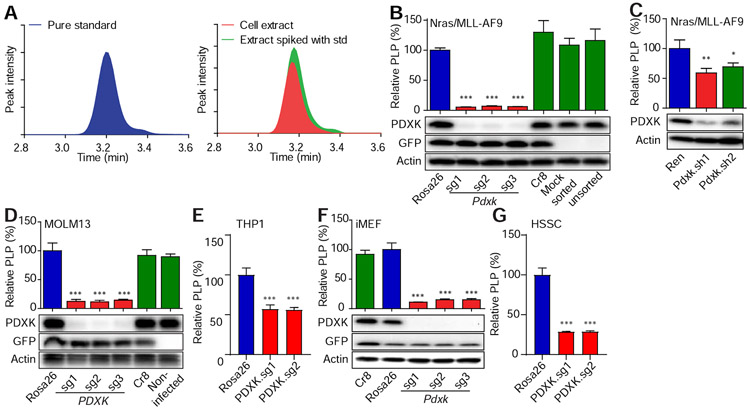
Figure 3. LC-MS method measures intracellular PLP.
(A) Chromatograms showing LC-MS detection of PLP (C8H10NO6P, extracted with a 20 ppm window). Detection of PLP in cells was confirmed by mass and retention time relative to the pure standard. (B-C) Nras(G12D)/MLL–AF9 leukemic cells were infected with viruses encoding indicated sgRNAs (Rosa26, n=3; Pdxk.sg1, n=4; Pdxk.sg2, n=3; Pdxk.sg3, n=3) (B) or shRNAs (Ren, n=4; Pdxk.sh1 and 2, n=3) (C). (D-G) MOLM13 leukemic cells (n=5) (D), THP1 leukemic cells (Rosa26, n=6; PDXK.sg1 and 2, n=4)(E), iMEF cells (Rosa26, n=5; Pdxk.sg1, n=2; Pdxk.sg2, n=5; Pdxk.sg3, n=4) (F) or human sarcoma (HSSC) (Rosa26, n=6; PDXK.sg1 and 2, n=4) cells (G) were infected with viruses encoding indicated sgRNAs. After infections (8 to 11 days for sgRNAs and 3 days for shRNAs), the PLP levels were measured by LC-MS and normalized to the level of Rosa26 sgRNA or Ren shRNA group. Western blot was performed to measure the expression levels of PDXK. ‘*’ represents p<0.05, ‘**’ represents p<0.01 and ‘***’ represents p<0.001 of t-test. Data are presented as average and SD.

