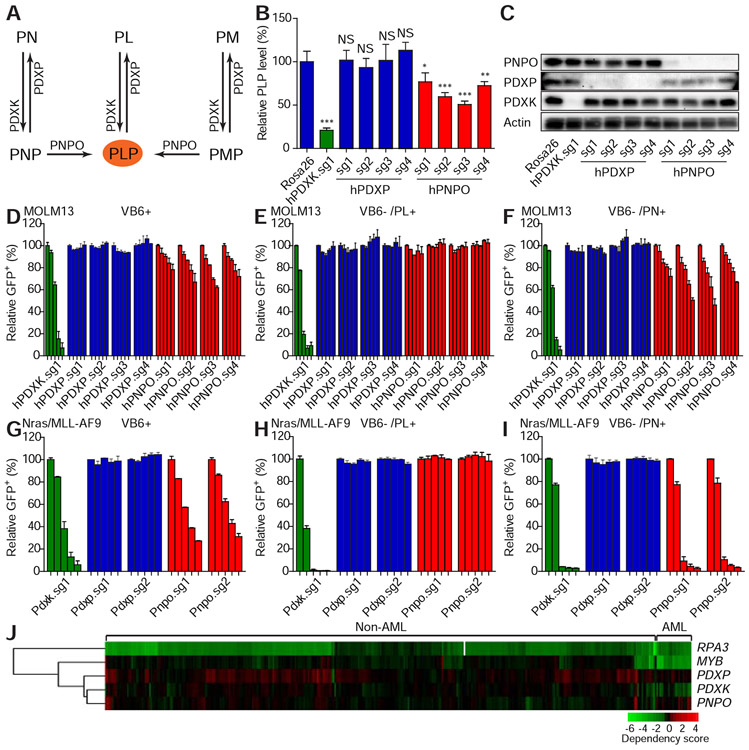
Figure 5. Vitamin B6 network is conditionally required for leukemic cell proliferation.
(A) The schematic diagram shows the vitamin B6 network. (B-C) MOLM13 leukemic cells were infected with viruses encoding indicated sgRNAs. After 11 days of infections, the intracellular PLP levels were measured by LC-MS and normalized to the level of the Rosa26 sgRNA group (B). The average and SD are shown in the histogram (n=4). ‘NS’ represents no statistical significance, ‘*’ represents p<0.05, ‘**’ represents p<0.01, and ‘***’ represents p<0.001 of t-test. Western blot was performed to measure the expression levels of PDXK, PDXP, and PNPO (C). (D-I) MOLM13 (D-F) or Nras(G12D)/MLL-AF9 (G-I) leukemic cells were cultured in complete medium (VB6 containing; D and G), VB6 deficient medium (VB6 free RPMI with dialyzed FBS) with PL (E and H) or PN (F and I). The cells were infected with viruses encoding indicated sgRNAs. The percentage of GFP+ infected cells were monitored on day 4, 9, 16, 21, and 30 (D, E and F) or on day 3, 6, 10, 12, and 14 (G, H, and I). The individual bar in histograms represents the GFP+ percentage on each day. The average and SD of relative GFP+ percentage are shown (n=2). (J) The dependency of indicated cell lines on listed genes was analyzed from the previously published data (Rauscher et al., 2017; Wang et al., 2017). Each row represents a gene. Each column represents a cell line. AML or non-AML cell lines are denoted on the top panel. Gene dependency score was calculated by taking the average of Log2FC (abundance fold-change) of all corresponding sgRNAs. This average Log2FC number was color-coded. Green represents depletion, black represents no change, and red represents an enrichment of indicated cell lines. Un-supervised clustering was used to cluster genes or experiments with similar phenotypes.

