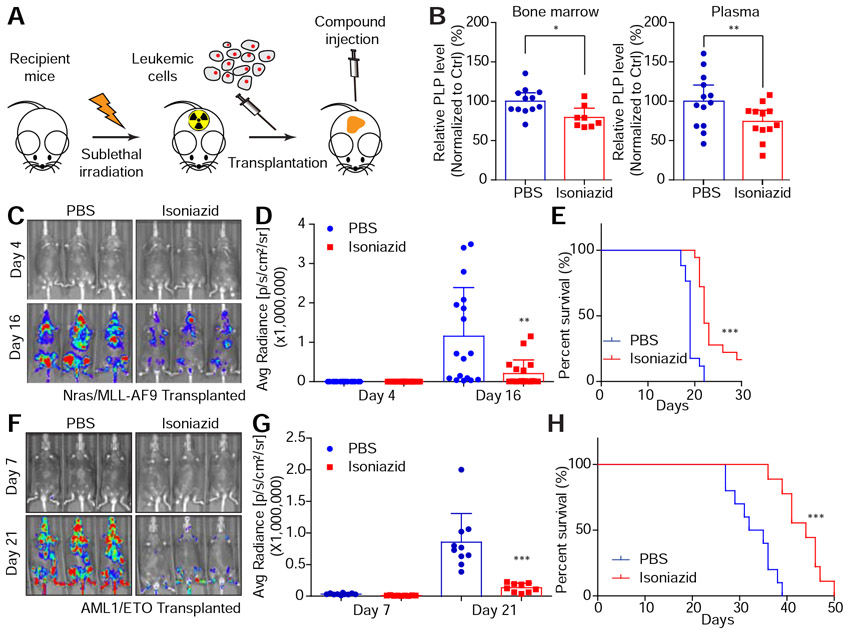
Figure 7. Pharmacological blockade of the vitamin B6 pathway exhibits anti-leukemia activity in vivo.
(A) The schematic diagram shows the in vivo leukemia mouse model. (B-E) Nras(G12D)/MLL–AF9 cells were transplanted to sub-lethally irradiated mice. PBS or 90 mg/kg isoniazid was intraperitoneally injected daily. The bone marrow (n=12 for PBS group and n=8 for isoniazid group) and plasma (n=13 for PBS group and n=12 for isoniazid group) were collected on day 12. PLP levels were measured by LC-MS and normalized to the PBS injection group (B). The average and SD are shown in the histogram. ‘*’represents p<0.05 and ‘**’represents p<0.01 of t-test. On day 4 and day 16, luciferase signals were detected (C), quantified and represented as average and SD (n=17 for PBS group and n=18 for isoniazid group) (D). ‘**’ represents differences with p<0.01 of t-test. Survival curves are shown (E). ‘***’ represents differences with p<0.001 of Log-rank (Mantel-Cox) test. (F-H) AML1/ETO cells were transplanted to sub-lethally irradiated mice. PBS (n=10) or 90 mg/kg isoniazid (n=9) was intraperitoneally injected daily. On day 7 and day 21, luciferase signals were detected (F), quantified and represented as average and SD (G). ‘***’ represents differences with p<0.001 of t-test. Survival curves are shown (H). ‘***’ represents p<0.001 of Log-rank (Mantel-Cox) test. See also Figure S7.

