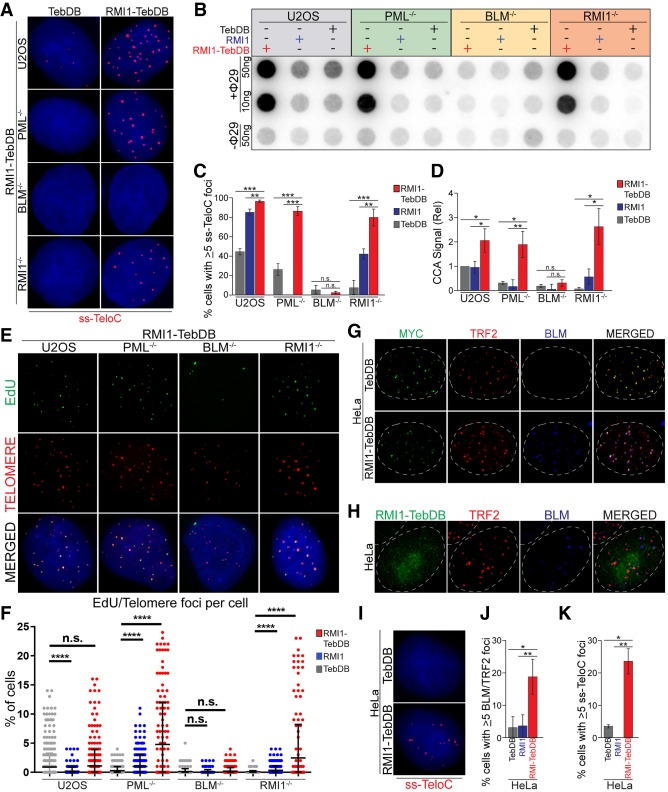
Figure 5.
Tethering of the BTR complex to telomeres can induce ALT phenotypes in a PML-independent manner. (A) ss-TeloC staining of PML−/− (clone 15G4), BLM−/− (clone 3D1), RMI1−/− (clone 1A8), and parental U2OS cells induced with doxycycline to express TebDB or RMI1-TebDB, showing the induction of ss-TeloC staining in PML−/− cells with the tethering of RMI1 to telomeres. (B) C-circle analysis of the same cells as in A, induced with doxycycline to express TebDB, RMI1, or RMI1-TebDB, showing the induction of C-circles in PML−/− cells with the tethering of RMI1 to telomeres. (C) Quantification of staining in A, repeated in triplicate with a minimum of 300 cells counted per condition. (**) P < 0.005; (***) P < 0.0005; (n.s.) P > 0.05. (D) Quantification of C-circle signal relative to parental U2OS cells in B. Repeated in triplicate. (*) P < 0.05; (**) P < 0.005; (n.s.) P > 0.05. (E) Representative images of the ATSA assay performed on cells in B, showing impaired EdU incorporation at telomers is restored in PML−/− cells with RMI1-TebDB expression. (F) Quantification of EdU foci colocalized with telomeres from the ATSA assay in F. Assay was repeated in triplicate with a minimum of 300 cells counted per condition. (****) P < 0.00005; (n.s.) P > 0.05. (G) Representative images of HeLa 1.2.11 cells transiently expressing myc-tagged TebDB or RMI1-TebDB (green), with staining of TRF2 (red) and BLM (blue), showing the localization of the TebDB constructs to telomeres and recruitment of BLM to telomeres with the RMI1-TebDB fusion protein. Nuclear boundary indicated by dashed lines. (H) Representative images of HeLa 1.2.11 cells induced with doxycycline to express RMI1-TebDB (green), with staining of TRF2 (red) and BLM (blue). (Dashed lines) Nuclear boundary. (I) Representative images of ss-TeloC staining of HeLa 1.2.11 cells induced with doxycycline to express TebDB or RMI1-TebDB, showing that RMI1-TebDB induces ss-TeloC staining in the telomerase-positive HeLa cells. (J) Quantification of cells in H. Staining repeated in triplicate with a minimum of 300 total cells counted per condition. (*) P < 0.05; (**) P < 0.005. (K) Quantification of cells in I. Staining repeated in triplicate with a minimum of 300 total cells counted per condition. (*) P < 0.05; (**) P < 0.005.

