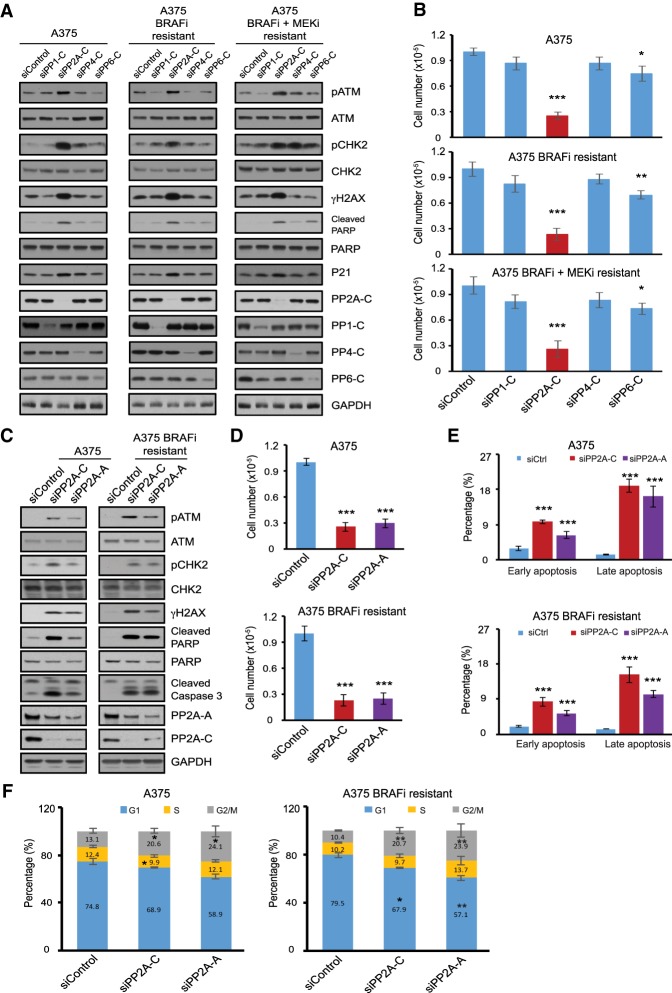
Figure 1.
Targeting DDR phosphatases in melanoma activates DNA damage signaling and inhibits cell proliferation. (A) Immunoblots of cell lysates collected 3 d after siRNA transfection from parental A375, A375 BRAFi-resistant, and A375 BRAFi + MEKi-resistant cells. The cells were transfected with control siRNA or siRNA targeting the catalytic subunits of protein phosphatases PP1-C (siRNA pool against α, β, and γ isoforms), PP2A-C (siRNA pool against α and β isoforms), PP4-C or PP6-C. (B) Proliferation assay of parental A375, A375 BRAFi-resistant, and A375 BRAFi + MEKi-resistant cells. The number of viable cells was counted 3 d after siRNA transfection as shown in A. Data are shown as average ± SD of three independent experiments. (C) Immunoblots of cell lysates collected 3 d after siRNA transfection from parental A375 and A375 BRAFi-resistant cells. The cells were transfected with control siRNA or siRNA targeting the catalytic subunits of protein phosphatases PP2A-C (siRNA pool against α and β isoforms) or scaffolding regulatory subunit PP2A-A (siRNA pool against α and β isoforms). (D) Proliferation assay of parental A375 and A375 BRAFi-resistant cells. The number of viable cells was counted 3 d after siRNA transfection as shown in C. Data are shown as average ± SD of three independent experiments. (E) Quantification of cell apoptosis measured by Annexin V staining flow cytometry. Parental A375 and A375 BRAFi-resistant cells were transfected with siRNAs as described in C and apoptotic cells were measured 3 d after transfection. Results were presented as average ± SEM (n = 2). (F) Cell cycle analysis for A375 and A375 BRAFi-resistant cells performed 3 d after transfection with siRNAs as described in C. Graphs show the percentage of cells in each phase of the cell cycle. Data shown are average ± SD of three independent experiments. (*) P < 0.05; (**) P < 0.01; (***) P < 0.001, by unpaired two-tailed Student's t-test.

