Figure 2.
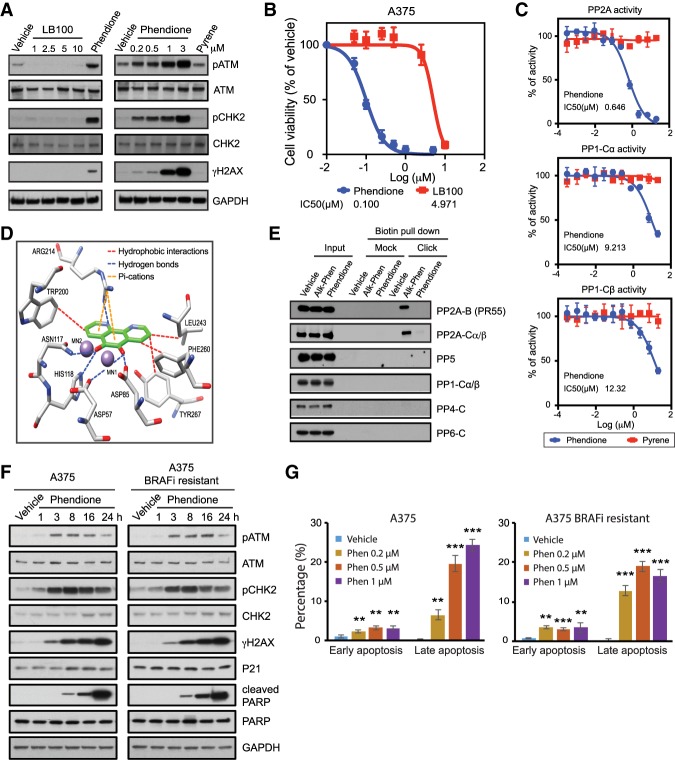
Phendione is a small molecule inhibitor targeting PP2A. (A) Immunoblots of A375 cell lysates collected after 3 h of drug treatment as indicated; i.e., increasing concentrations of LB100 compared with 0.2 µM phendione (left) and increasing concentrations of phendione compared with 3 µM pyrene (right). DMSO was used as negative control (vehicle). (B) Growth inhibition curves of A375 cells and IC50 values after treatment with phendione or LB100 for 96 h. Data are presented as mean ± SD of three independent experiments. (C) Phosphatase activity assay for PP2A core enzyme (complex of regulatory subunit Aα and catalytic subunit Cα; top), PP1 catalytic subunit Cα (middle) and PP1 catalytic subunit Cβ (bottom) incubated with phendione or pyrene at indicated concentrations. Data shown are average ± SD of two independent experiments. IC50s (micromolar) were calculated and is shown as an inset in each graph. (D) Binding model of phendione to PP2A. Docking pose of phendione (green) interacting with the catalytic residues of PP2A-Cα (PPP2CA) (white) within 5 Å around the ligand. Oxygens (red), nitrogens (blue), and manganese ions (purple) are shown. Dotted lines represent intermolecular polar contacts. Hydrogens are omitted for clarity. (E) Immunoblots for phendione derivative pull down. (F) Immunoblots of A375 and A375 BRAFi-resistant cell lysates after treatment with 0.2 µM phendione or vehicle for indicated time. (G) Quantification of cell apoptosis measured by Annexin V staining flow cytometry. Parental A375 and A375 BRAFi-resistant cells were treated with vehicle or increasing concentration of phendione as indicated in the panels for 24 h before apoptotic cells were measured by flow cytometry. Results were presented as average ± SD (n = 3). (**) P < 0.01; (***) P < 0.001, by unpaired two-tailed Student's t-test.

