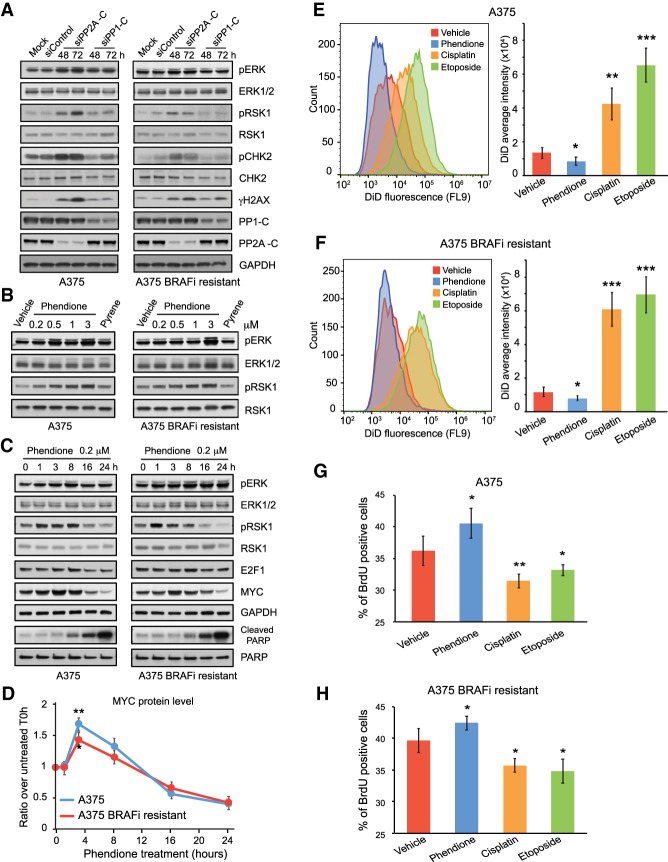
Figure 5.
PP2A inhibition transiently promotes cell proliferation leading to evasion from dormancy. (A–C) Immunoblots of cell lysate collected from A375 and A375 BRAFi-resistant cells after 2 and 3 d of siRNA transfection (A), 3 h of drug treatment (B), and time-course treatment with 0.2 µM phendione (C) as indicated in each panel, respectively. siRNAs used for transfection include control siRNA, siRNA targeting the catalytic subunits of protein phosphatases PP1-C (siRNA pool against α, β, and γ isoforms) and PP2A-C (siRNA pool against α and β isoforms). (D) Quantification of MYC protein level from immunoblots after time-course treatment with 0.2 µM phendione in A375 and A375 BRAFi-resistant cells. GAPDH protein level was used as internal control to perform normalization. Data shown are mean ± SEM of three independent experiments. (E,F) Histogram and quantification of fluorescent signal from Vybrant DiD cell-labeling dye detected by flow cytometry. (G,H) Quantification of incorporated bromodeoxyuridine (BrdU) measured by flow cytometry. Data shown are mean ± SD of two independent experiments. (*) P < 0.05; (**) P < 0.01; (***) P < 0.001. Unpaired two-tailed Student's t-test was used for statistical analysis.

