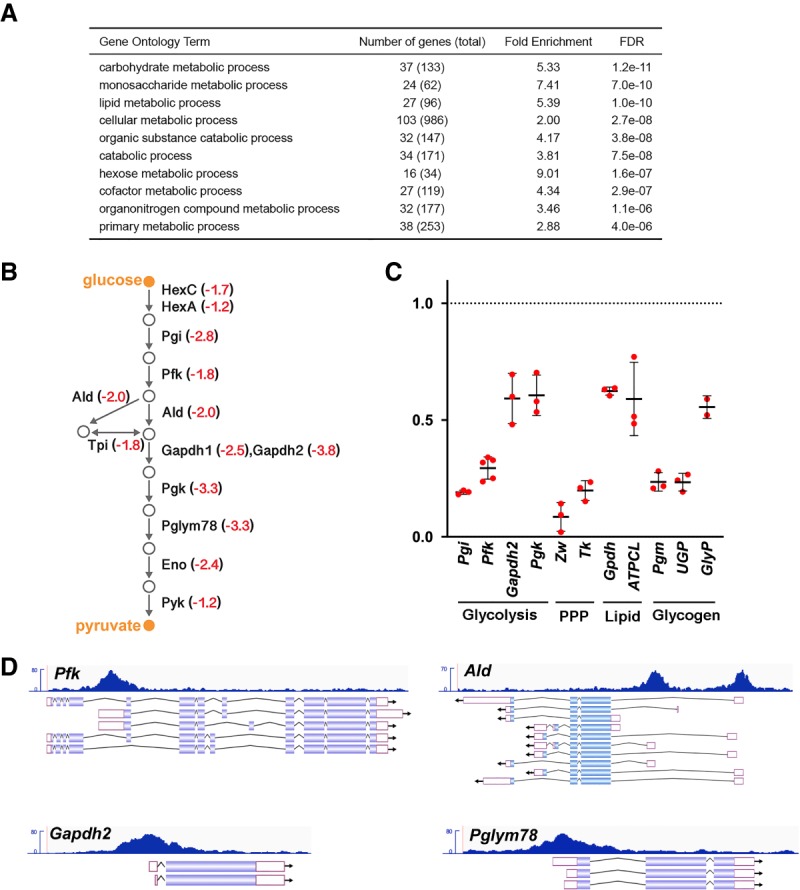
Figure 3.

dERR directly maintains glycolytic gene expression in adults. (A) Gene ontology (GO) enrichment analysis of genes expressed at a significantly reduced level in dERR mutants relative to controls as determined by RNA-seq. GO term analysis was performed using the Biological Processes designation in PANTHER GO-slim, and categories are listed in order by FDR. (B) A schematic is shown depicting the glycolytic pathway in Drosophila with the average fold-change in transcript levels in dERR mutants as determined by RNA-seq (red). (C) RT-qPCR measurement of mRNA levels corresponding to key genes in glycolysis, the pentose phosphate pathway (PPP), lipid metabolism, and glycogen metabolism in dERR mutants relative to controls. mRNA values were normalized to rp32 expression and fold-change values were calculated using the comparative CT method. n = 2–5 independent samples with 10–15 animals per sample. Lines indicate mean ± SD. (D) ChIP-seq analysis performed on adult animals for dERR-3xFlag genomic binding shows direct association with genes involved in glycolysis. Data tracks display fragment pileup from MACS2 (Y-axis) at four significantly bound dERR target loci. The read accumulation histogram (dark blue) is aligned to the isoforms of each gene, with protein coding sequences (filled boxes), introns (lines), and UTRs (open boxes) shown.
