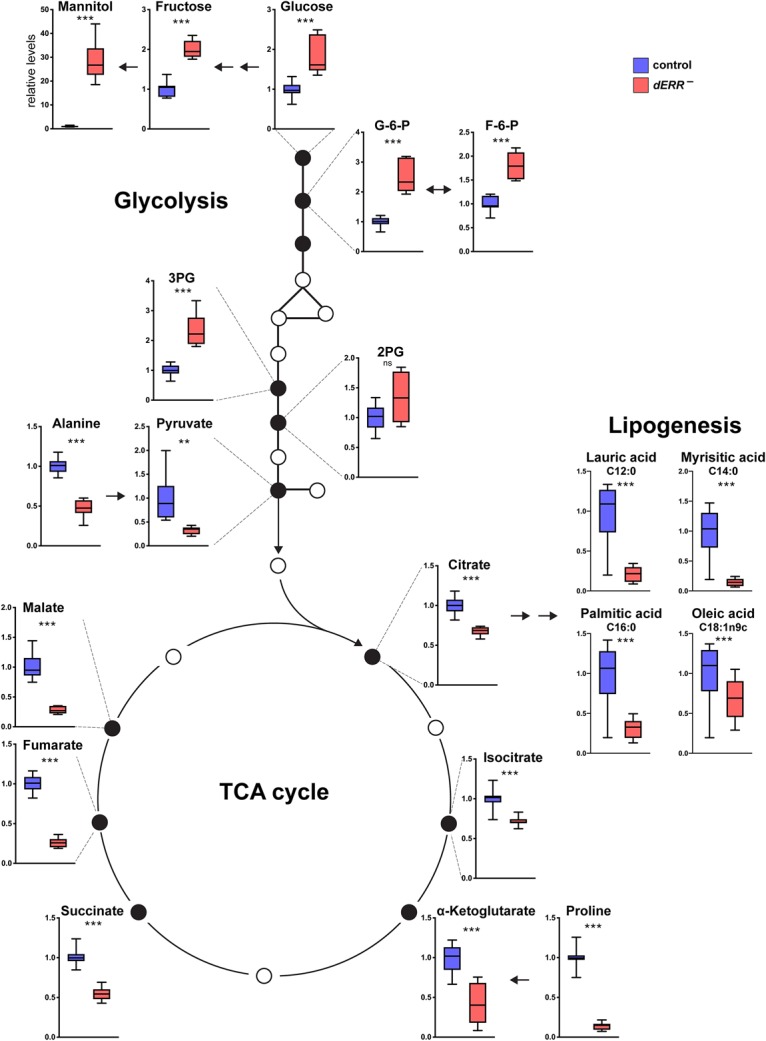
Figure 4.

dERR mutants display reduced glycolytic oxidation. GC/MS metabolomic profiling of 6-d-old controls (blue) and dERR mutants (red) raised to adulthood on a normal diet (9% sugar) and transferred to a 15% sugar diet at eclosion. n = 8–12 independent samples with 20 animals per sample. Metabolite data are from three independent GC/MS experiments, with the exception of the fatty acid measurements, which were performed in one GC/MS experiment. Values were normalized to control levels for each metabolite. (***) P ≤ 0.001; (**) P ≤ 0.01; (ns) P > 0.05.
