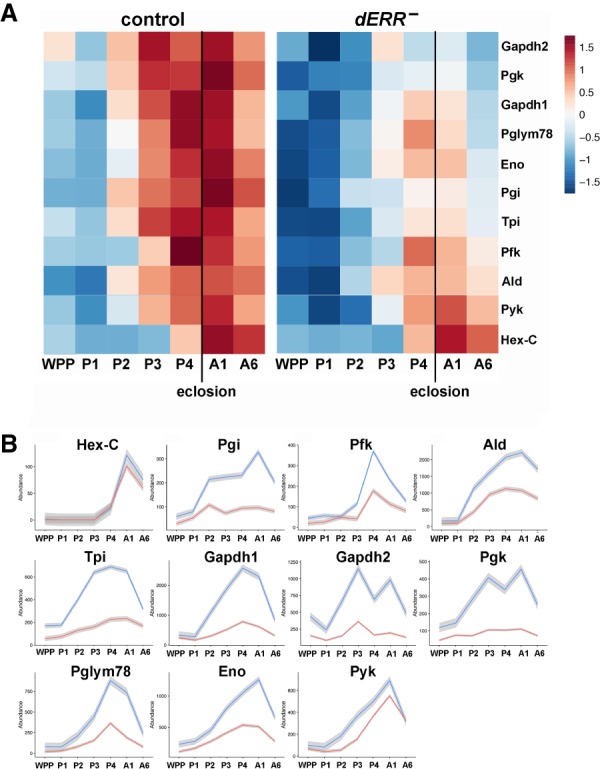
Figure 6.

dERR is required for the induction of glycolytic gene expression in late pupae. (A) Heat maps of relative gene expression are depicted for transcripts encoding central enzymes in glycolysis from staged controls (left) and dERR mutants (right) using RNA-seq data. Genes are ordered vertically by median expression value over time. Eclosion is marked with a vertical line. (B) Expression plots through time are depicted for transcripts that encode glycolytic enzymes in controls (blue) and dERR mutants (red). Mean values at each time point are plotted to make the line, with the gray border representing the standard error bounds using a LOESS fitting. Expression levels are shown as transcripts per million (TPM) normalized expression values to account for gene size and total RNA in the sample. Animals were staged as: white prepupae (WPP), day 1 pupae (P1), day 2 pupae (P2), day 3 pupae (P3), day 4 pupae (P4), day 1 adult (A1), day 6 adult (A6). RNA-seq data was derived from triplicate samples with 15 animals per sample.
