Figure 3.

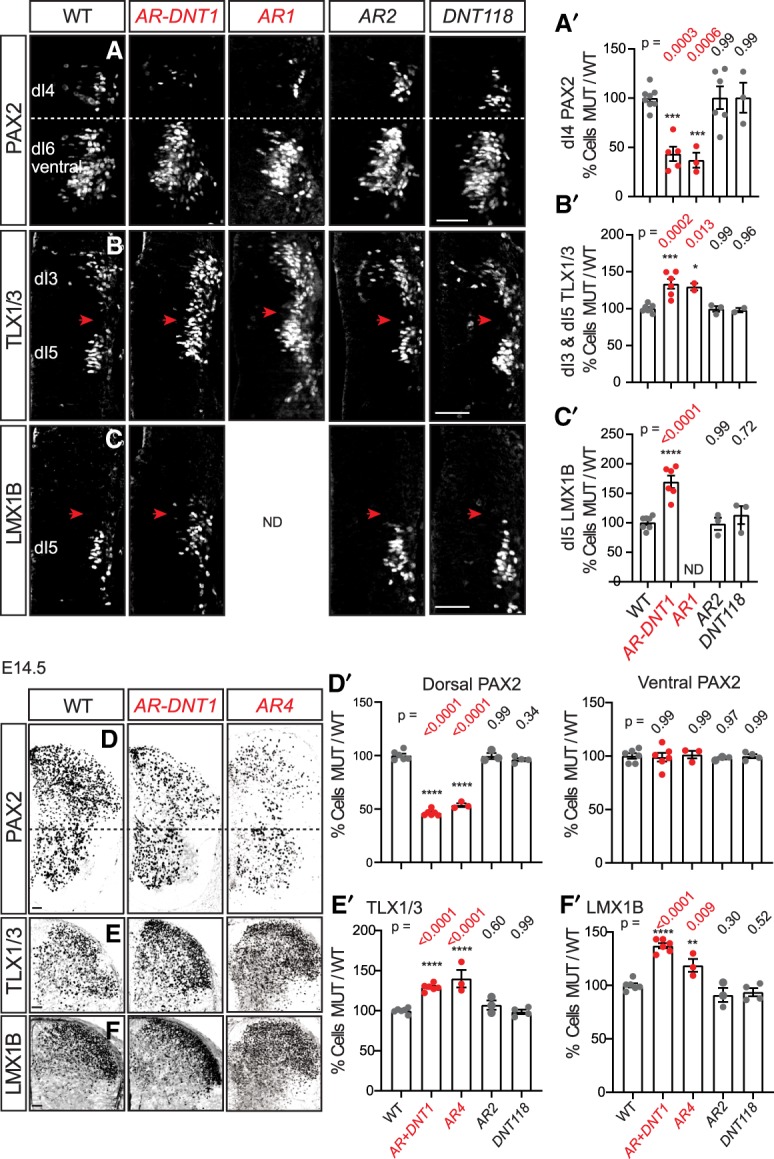
Ptf1a enhancer mutants have a reduced number of PAX2+ and an increase in TLX1/3+ and LMX1B+ neurons. (A–C) Expression of PAX2, TLX1/3, and LMX1B in transverse hemisections of mouse E10.5 neural tube. (A,A′) PAX2+ cells (dI4) are decreased in Ptf1a homozygous mutants with the scratch phenotype (AR-DNT1 and AR1) but not in mutants with no scratch phenotype (AR2 and DNT118) relative to littermate controls. In contrast, the number of TLX1/3+ cells (dI3/5) (B,B′) and LMX1B+ cells (dI5) (C,C′) are increased, occupying the dI4 domain (red arrowheads). (D–F) Expression of PAX2, TLX1/3, and LMX1B in transverse hemisections of mouse E14.5 neural tube. Similar to earlier stages, there is a loss of PAX2+ cells in the dorsal but not ventral spinal cords (D,D′), and there is an increase in TLX1/3+ (E,E′) and LMX1B+ (F,F′) cells in AR-DNT1 and AR4 but not in AR2 and DNT118 relative to littermate controls. Quantification reports the change in number of marker+ cells per section in mutant relative to WT controls. Each data point represents a biological replicate (N) and error bars indicate SEM. One-way ANOVA was used to determine significant differences relative to WT. P-values are as indicated. (*) P < 0.05; (**) P < 0.01; (***) P < 0.001; (****) P < 0.0001. Scale bar, 50 µm. See also Supplemental Fig. S3.
