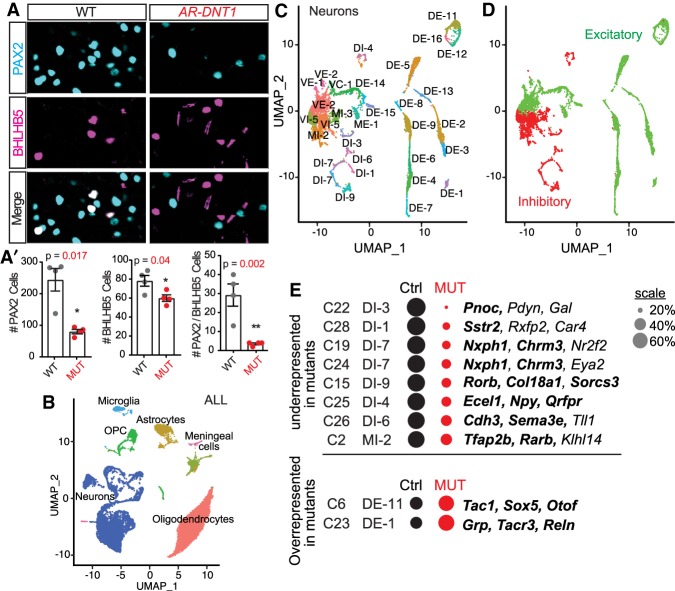
Figure 6.
Reduced PTF1A levels alter the balance of inhibitory and excitatory neurons in the dorsal spinal cord. (A,A′) Immunocytochemistry for PAX2 and BHLHB5 on P5 cervical spinal cords from superficial lamina I & II show a reduced number of PAX2/BHLHB5 neurons (yellow arrowheads) in AR-DNT1 mutants when compared with WT. Quantification reports the number of marker+ cells per hemisection (A′). Each data point represents a biological replicate (N), error bars indicate SEM. Student's t-test was used to determine significant differences relative to WT. P-values are as indicated. (*) P < 0.05; (**) P < 0.01. Scale bar, 50 µm. (B–D) UMAP visualization of the snRNA-seq from P25 cervical spinal cords from Ptf1aCre/AR-DNT1;Ai14 and Ptf1aCRE/+;Ai14 controls. (B) Clusters identified by major cell type. (C) Neurons were analyzed separately generating 31 clusters. Annotations are from pairwise Pearson correlation analysis between the data sets generated in this study and that of Sathyamurthy et al. (2018). (DI) dorsal inhibitory; (DE) dorsal excitatory; (VI) ventral inhibitory; (VE) ventral excitatory; (MI) mid inhibitory; (ME) mid excitatory; (VC) ventral cholinergic. (D) illustrates the separation of excitatory and inhibitory neuronal clusters. (E) A comparison of the proportions of control (Ctrl) and MUT nuclei were calculated relative to the total number of nuclei in the respective population and are represented by the size of the circle, and those clusters that are over or under represented in AR-DNT1 mutants relative to Ctrl are shown. Cluster annotations from this study (C), the associated annotation from Sathyamurthy et al. (2018), and marker genes for the cluster are shown. Genes in bold were also used as defining markers in Sathyamurthy et al. (2018). See Supplemental Table S2 for details including the P-values used to determine whether a cluster had significantly different contributions from the different genotypes. See Supplemental Figure S6 for visualization of genes supporting UMAP visualizations in B–D.

