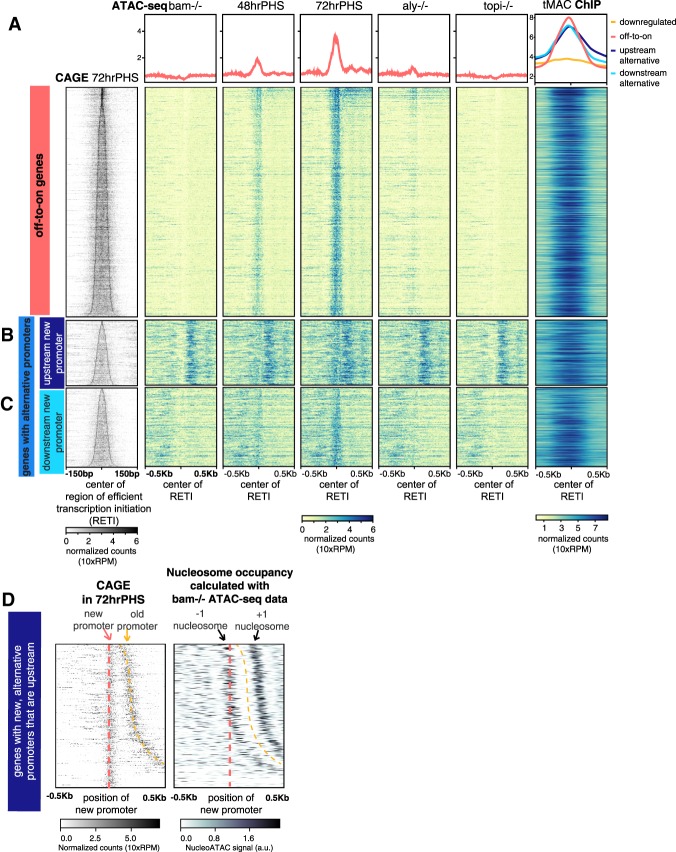
Figure 3.
tMAC binds to and promotes opening of promoters that become expressed in spermatocyte-enriched samples. (A–C, left column) CAGE signal for promoters newly expressed in hsBam;bam−/− 72 hrPHS testes aligned by center of the RETI and sorted by RETI width. (Middle columns) ATAC-seq signal in different conditions. (Right column) tMAC ChIP-seq signal data from (Kim et al. 2017). (Top row) Average of data in panels below. Heat map scale: Read counts were normalized by library size, effectively 10-fold of reads per million (RPM) (see the Supplemental Material). (A) Off-to-on genes. (B,C) Genes with alternative promoters with new spermatocyte-specific promoters upstream of (B) or downstream from (C) the old promoters. (D, left) CAGE signal for genes in B sorted by increasing distance between old and upstream new alternative promoters. (Right) Nucleosome positions for the old, spermatogonial promoters sorted in the same order. The darkest regions indicate most likely nucleosome dyad position.

