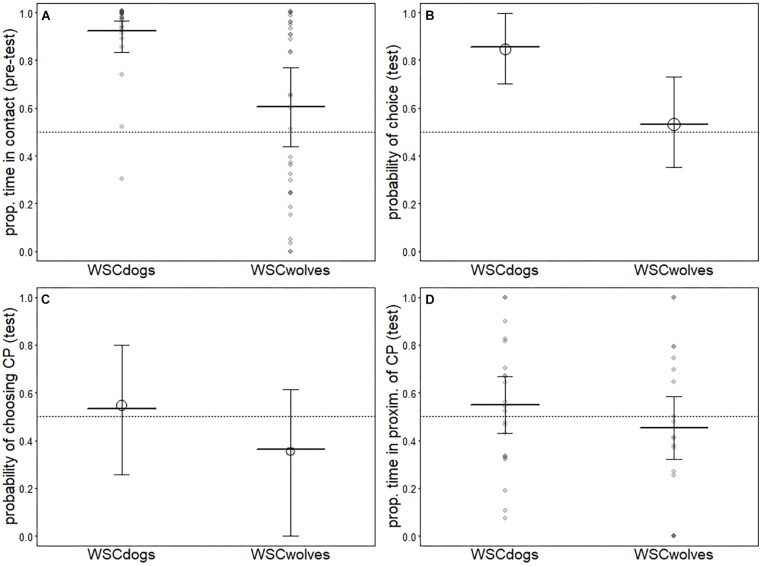
FIGURE 1.
Results for the models comparing WSC dogs and WSC wolves. Indicated are the average response [circles in (B) and (C)] as well as the fitted model (thick horizontal lines) and its confidence intervals (error bars). Darker dots in (A) and (D) depict observations falling on top of one another.

