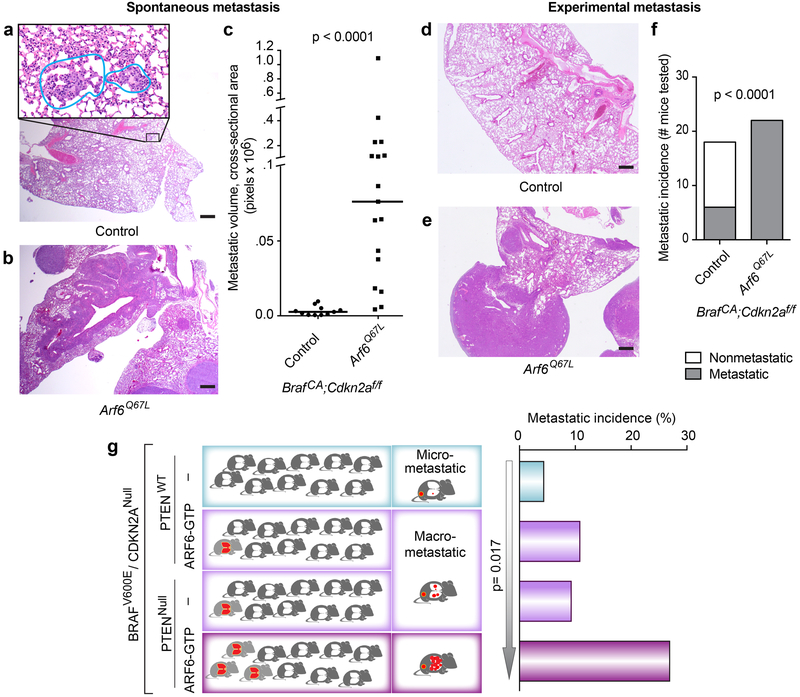
Figure 1. ARF6-GTP is sufficient to potentiate metastasis of BRAFV600E / Cdkn2aNULL tumors, and is equipotent as PTENNULL.
(a-c) Spontaneous pulmonary metastatic burden. (a) Micro-metastases (insert, outlined) from BrafCA;Cdkn2af/f (control) mouse. (b) Multiple, large, spontaneous metastases in BrafCA;Cdkn2af/f + Arf6Q67L mouse. (c) Metastatic volume in mice with metastases, Mann-Whitney test, two-tailed. (d-f) Lung colonization of tumor cells derived from BrafCA;Cdkn2af/f ± Arf6Q67L mice, injected into tail veins of NOD SCID mice. d) Benign lung, control mouse. e) Lung with tumor colonies. f) Number of mice with pulmonary tumor colonies by 4 weeks post-injection, Fisher’s exact test, two tailed. H&E images = 20x magnification (larger images, scale bar = 500μm) with 400x magnification of metastatic focus (panel a, insert, scale bar = 20μm). (g) Metastatic incidence and volume from BRAFV600E/CDKN2ANull tumors +/− ARF6-GTP or PTEN or both. Histogram (right): overall significance was evaluated by 2×4 Fisher’s exact test, p=0.042. 2×2 Fisher’s exact test, two-tailed, p=0.0498 for PTENNull vs. PTENNull+ ARF6-GTP. Arrow = Linear by Linear association test, based on the order shown. Diagram (left) illustrates the overall phenotypic patterns for each cohort, where the right column reflects the volume of disease burden (red) in metastatic mice and the left column reflects the overall incidence of metastatic mice (red). See also Figure S4e.

