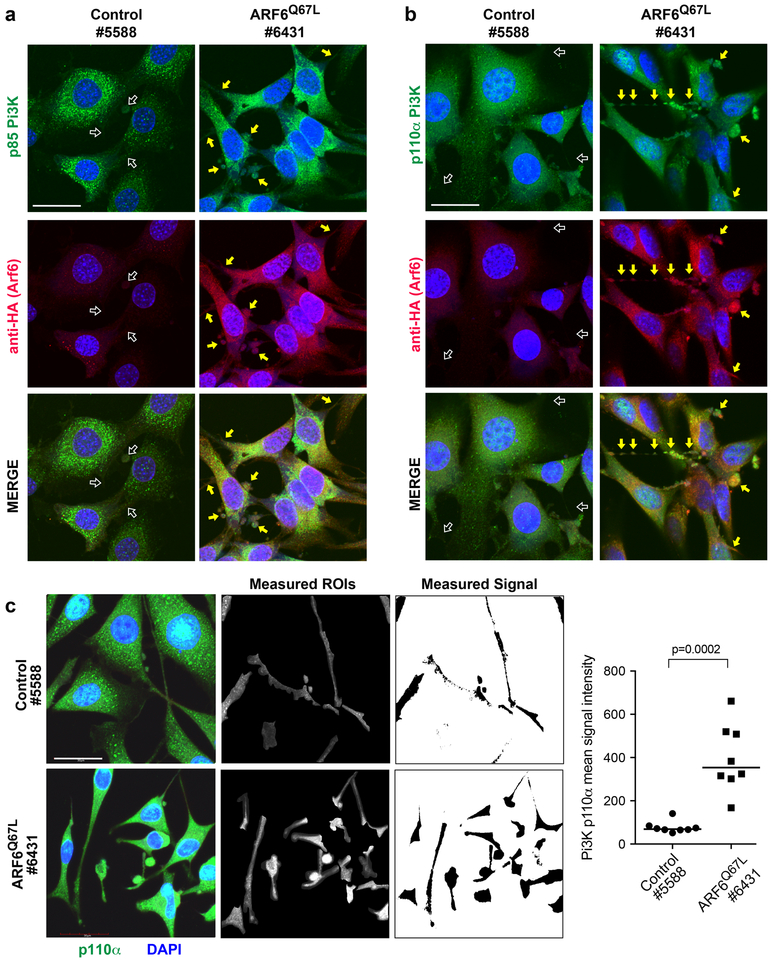
Figure 3: ARF6-GTP increases the distribution of p110α PI3K in cellular protrusions in melanoma.
Primary melanoma cells derived from mouse tumors, 1200x magnification, scale bars = 30μm. Left panels = BrafCA;Cdkn2af/f control (5588). Right panels = BrafCA;Cdkn2af/f + Arf6Q67L (6431), where arrows highlight bulbous and spinous cellular projections. (a) Green = anti-p85 PI3K. (b) Green = anti-p110a PI3K. (a-b) Red = anti-HA (HA-tagged ARF6Q67L). Blue = DAPI. (c) Quantification of p110α PI3K (green) in bulbs and spines (outlined regions, right panel). ROI=regions of interest selected for quantification of p110α signal intensity. All bulbo-spinous processes were quantified for all cells in eight distinct images per cell line Representative images shown, 1800x magnification, scale bars = 20μm. Mann-Whitney U test.

