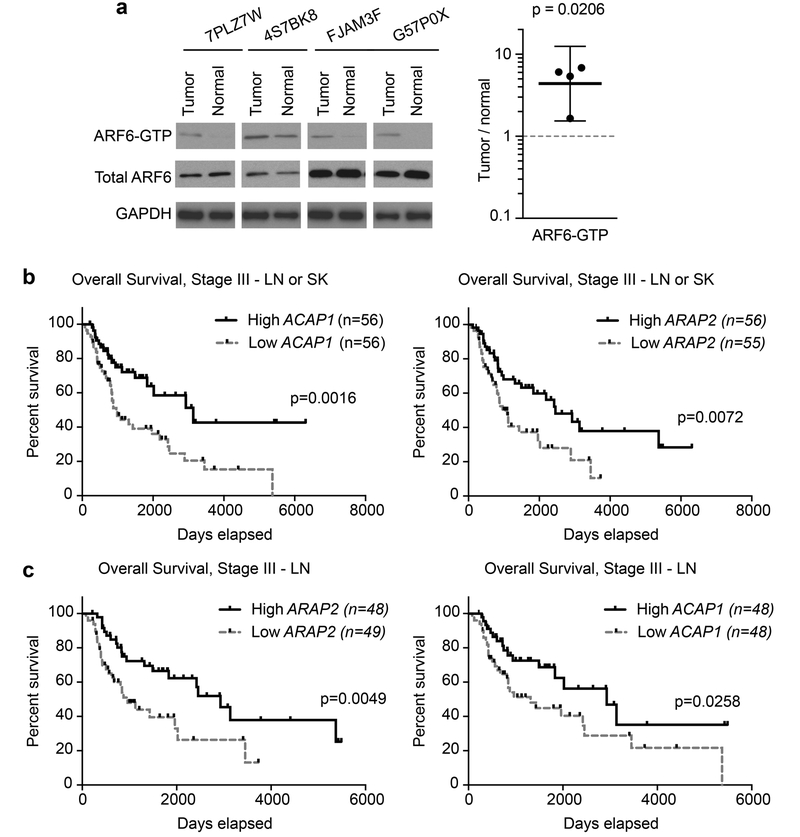
Figure 7. Evidence for aberrant ARF6 activation in melanoma.
(a) Western blot of ARF6-GTP pull downs from paired patient samples with quantified ARF6-GTP levels per 500 mg of total protein input. Paired ratio t-test, two-tailed, bars = 95% c.i.. Each tumor sample is paired with its patient-matched, nontumor (normal) tissue type that was surgically resected and processed simultaneously. Normal tissues include lymph node, fibroadipose, liver, and skin (respectively, left to right). (b-c) Reduced ARF6-GAP expression in skin (SK) and lymph node (LN) metastasis correlates with a reduced overall survival in Stage III patients TCGA melanoma patients. The RNA expression ranks for ACAP1 and ARAP is shown. Higher rank indicates higher gene expression. Reduced ARAP2 and ACAP1 expression correlate with reduced overall survival from time of diagnosis. Log-rank (Mantel-Cox) test. See also Figure S7.

