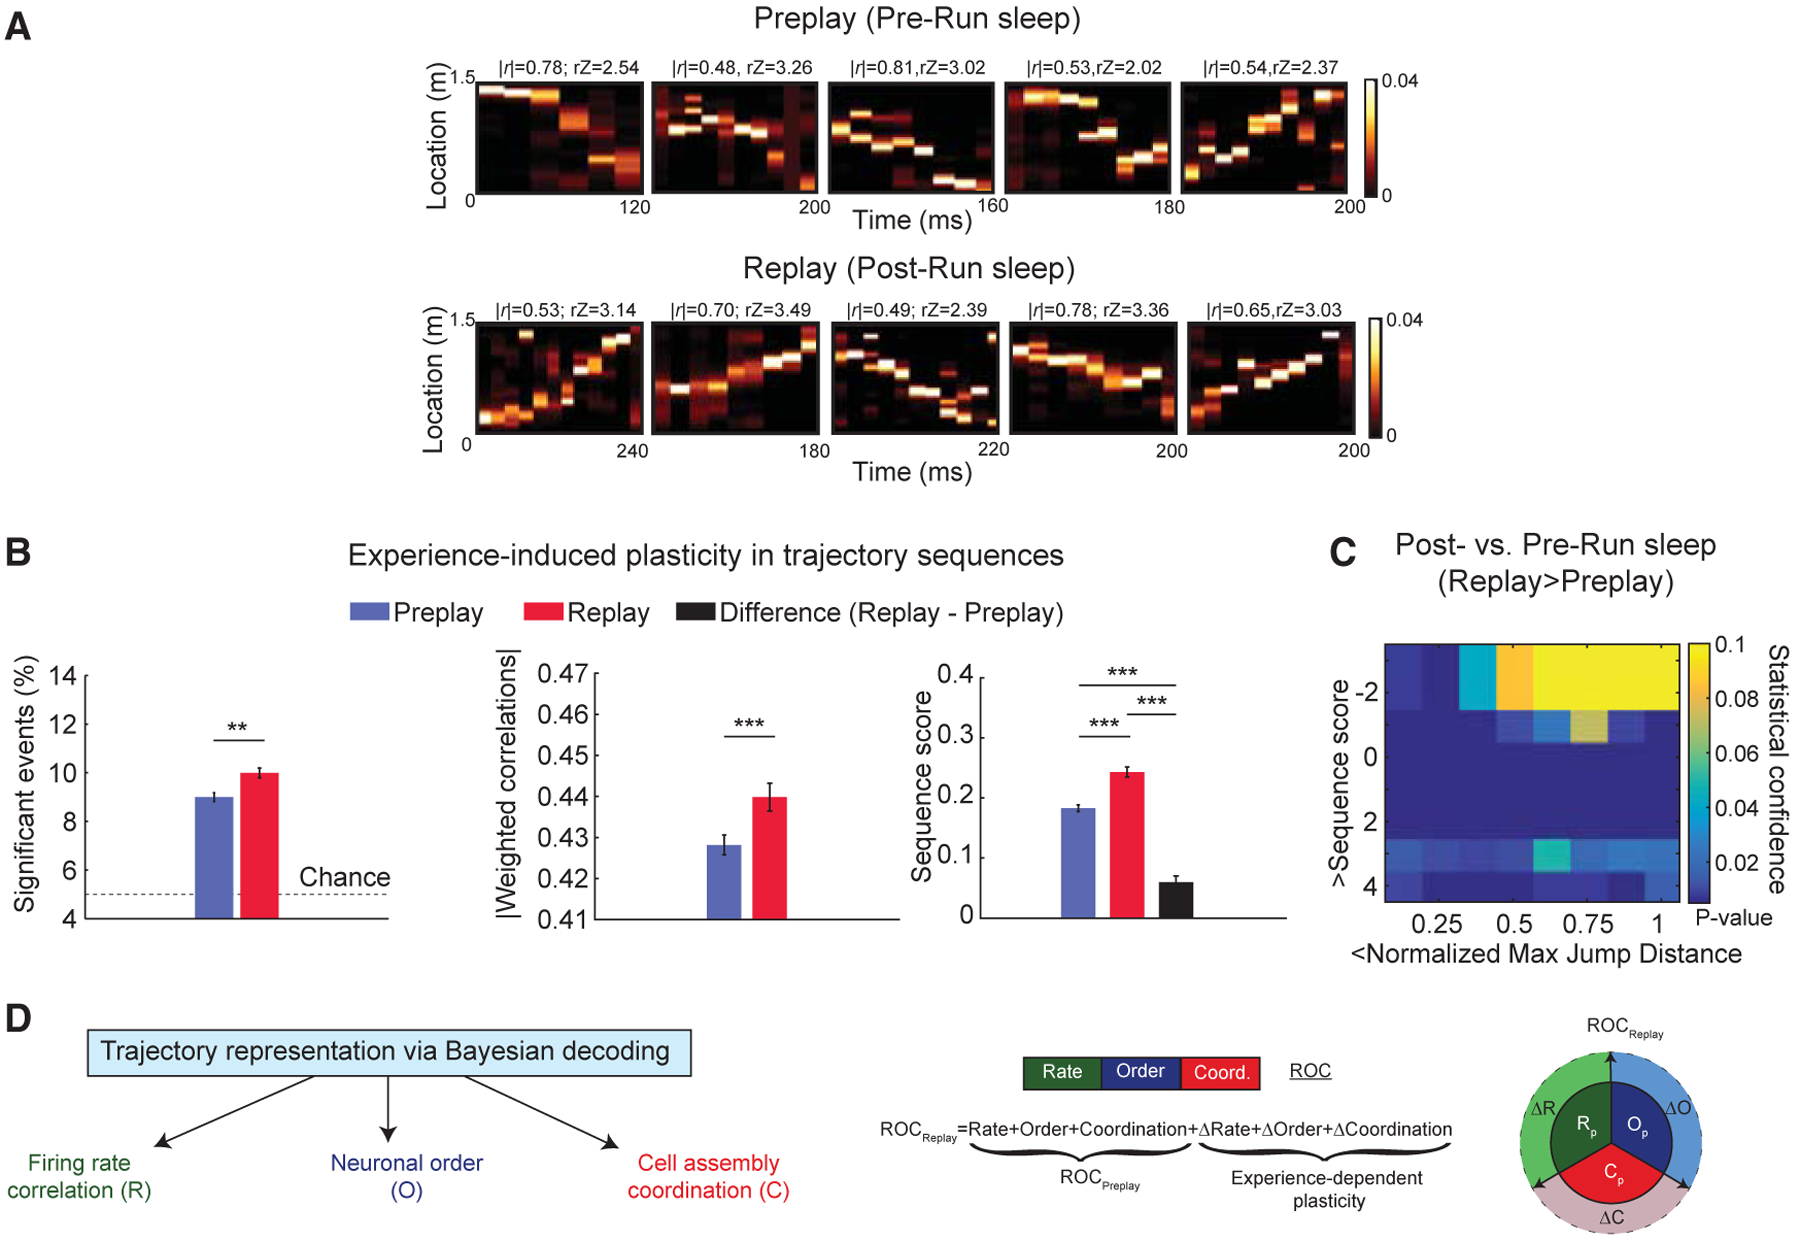
Figure 2. Temporally Compressed Replay Represents Run Trajectory Stronger than Preplay during Sleep.

(A) Representative trajectory preplay (in Pre-Run sleep) and replay (in Post-Run sleep) at comparable frame durations using Bayesian decoding.
(B) Comparison of multiple features of trajectory preplay (n = 38,820 frames) and replay (n = 17,637 frames). (Left to right) Proportion of significant events, significant absolute weighted correlations, and sequence scores are shown (black bar: difference between Post- and Pre-Run sleep frames). **p < 0.01, ***p < 0.001. Data are represented as mean ± SEM.
(C) p value matrix of comparisons of sequence scores and normalized maximum jump distances between Pre- and Post-Run sleep frames depiction of de novo Run trajectories.
(D) Trajectory representation using Bayesian decoding is contributed by multiple types of neural codes: firing rate “R,” order of neurons into extended sequences “O,” and coordination of neurons into cell assemblies at millisecond timescales “C,” left. (Middle) Replay is inferred as an experience-related plastic transformation of preplay reflected at the level of the 3 neural codes (R, O, and C). (Right) Graphical representation of experience-induced changes in firing rates (ΔR), coordination of neurons (ΔC), and neuronal order (DO) is shown.
