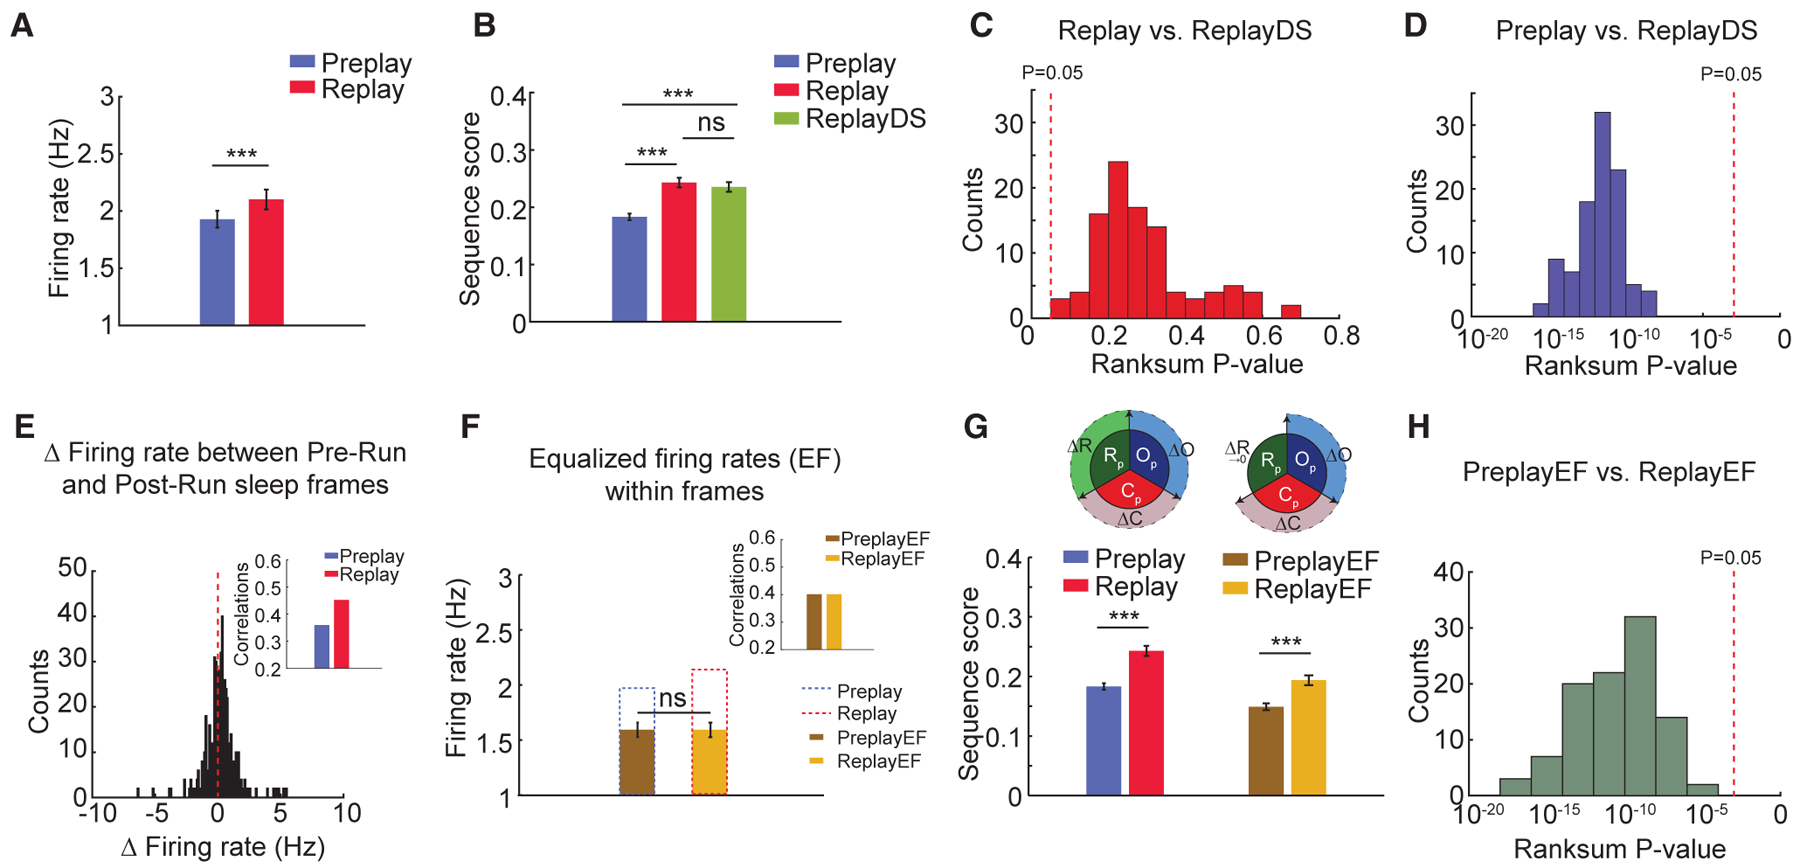
Figure 3. Contribution of Changes in Firing Rates to the Improvement of Trajectory Representation from Pre-Run to Post-Run Sleep.

(A) Firing rates of neurons increase from Pre-Run sleep (Preplay) to Post-Run sleep (Replay).
(B) Sequence scores of random down sampling of neuronal firing rates from Post-Run sleep into Pre-Run sleep levels (ReplayDS) demonstrate that experience-related changes in overall firing rates are not sufficient to account for the observed differences between trajectory replay and preplay.
(C and D) ReplayDS sequence scores are similar to the original replay scores (C) and are higher than the preplay scores (D). p values are from 100 independent rank sum tests.
(E) Firing rates within frames change from Pre- to Post-Run sleep variably across neurons. (Inset) Overall correlation of firing rates between sleep frames and Run increases from Pre- to Post-Run sleep.
(F) Equalization of firing rates (EF) and sleep-Run correlations (100 iterations, inset) between Pre-Run (PreplayEF) and Post-Run (ReplayEF) sleep frames after down-sampling spikes from neurons with increased firing rates in specific Pre- and Post-Run sleep sessions.
(G) Preplay and replay sequence scores before and after equalization of firing rates. (Inset) Graphical representation of equalization in firing rates between Preand Post-Run sleep is shown.
(H) p values of comparisons between sequence scores in PreplayEF and ReplayEF (100 iterations).
For (A), (B), (F), and (G): ***p < 0.001, ns = not significant. Data are represented as mean ± SEM.
