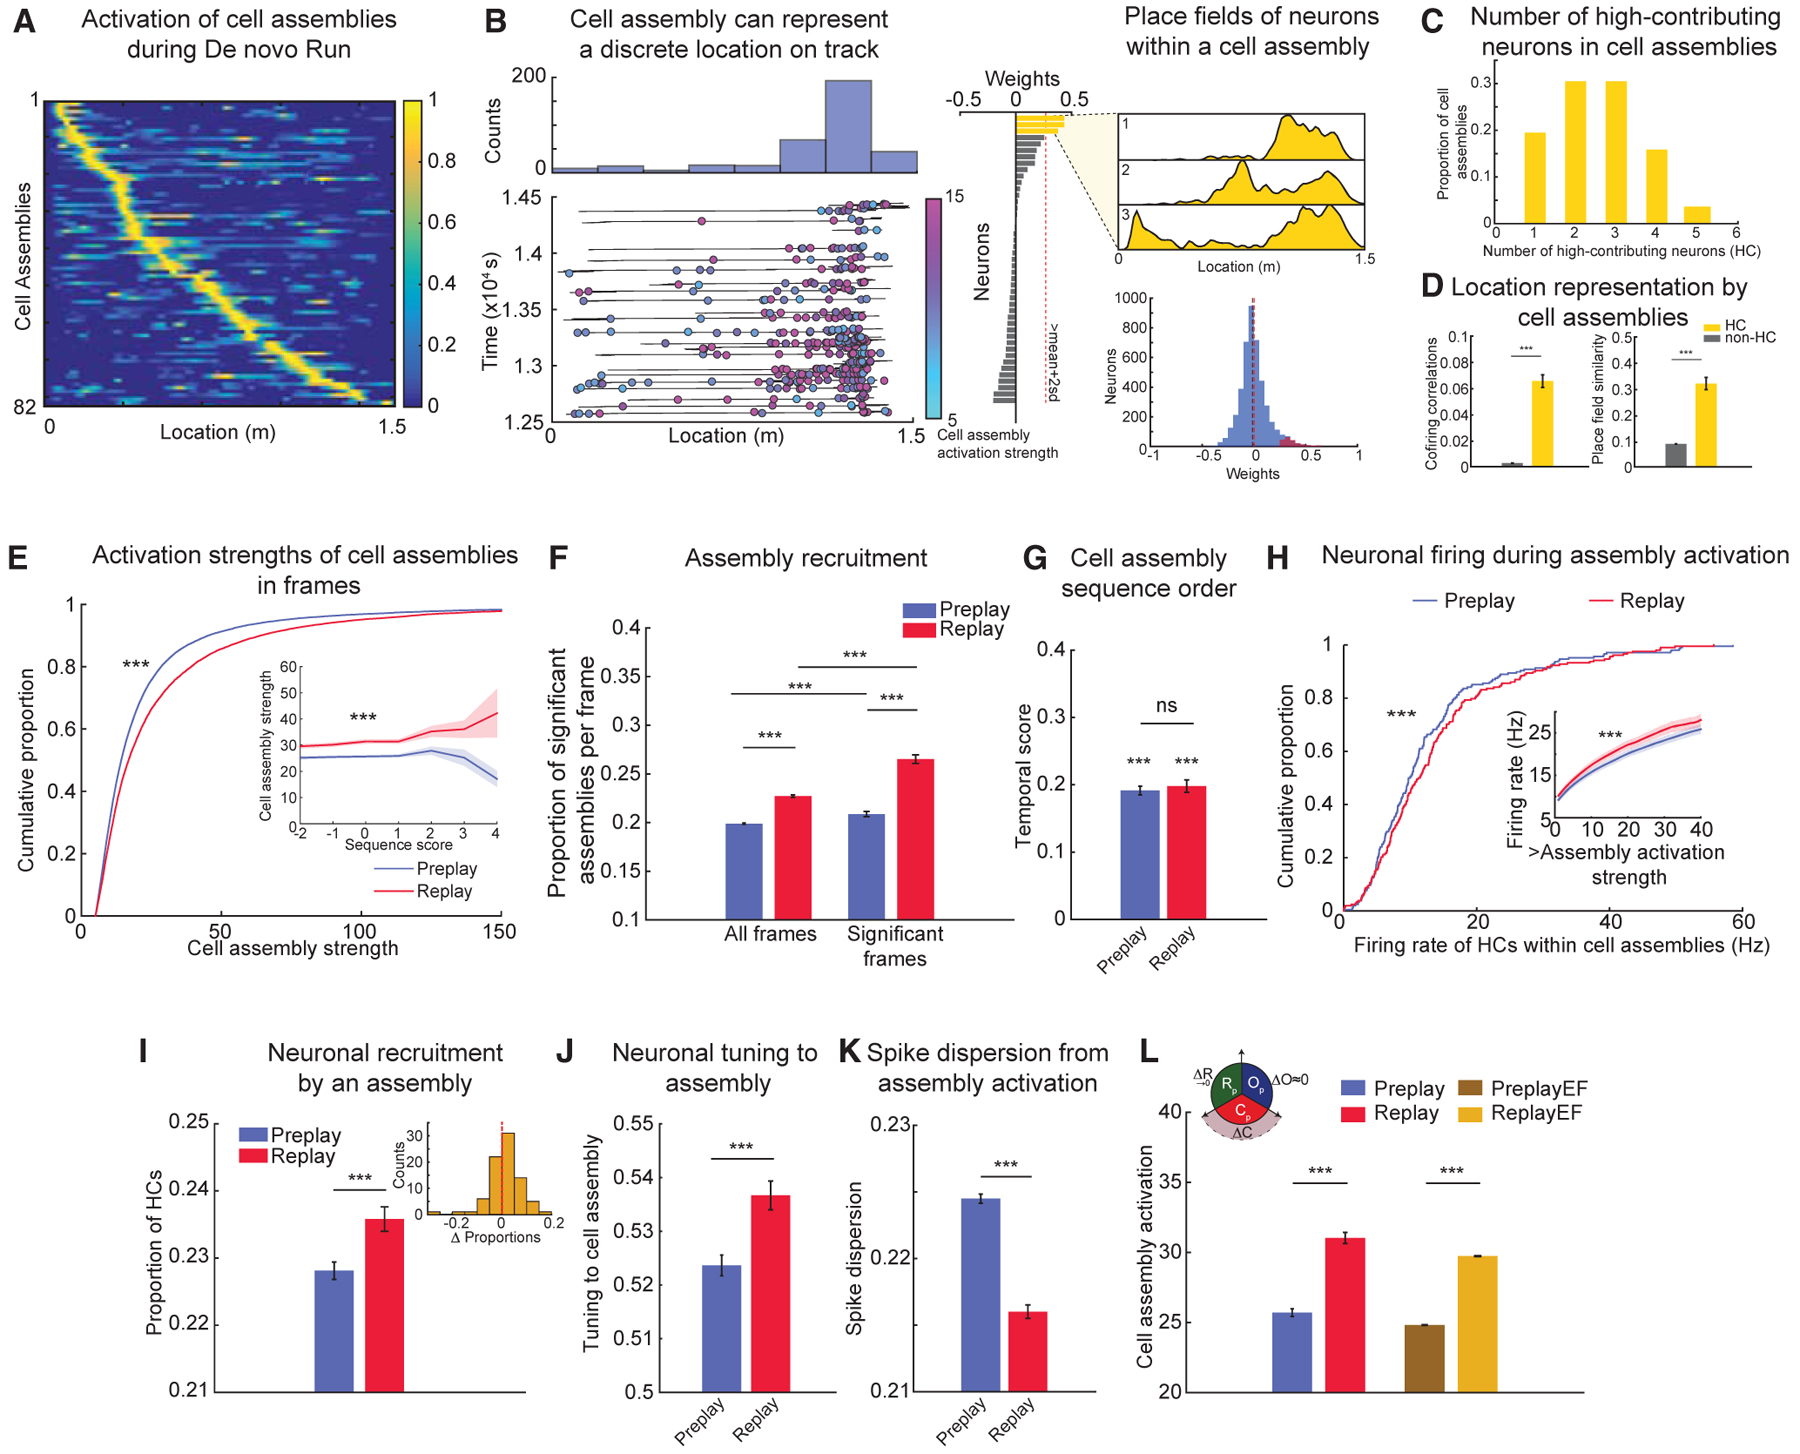
Figure 5. Experience-Dependent Changes in Neuronal Properties of Cell Assemblies from Pre- to Post-Run Sleep.

(A) Cell assemblies detected during Run sessions represent discrete locations along an animal’s trajectory through the linear environment.
(B) Representative example of a cell assembly activated on the track (left, bottom); colors and color bar depict activation strengths during Run. Histogram (left, top) depicts counts of activation across multiple laps on the track. (Middle) Weights of neurons contributing to this cell assembly are shown. Note that three neurons (yellow) are high contributors (HCs) to this cell assembly. (Right, top) Place fields of the HC neurons to this cell assembly are shown. (Right, bottom) Weights of all neurons (blue) and HC neurons (red) to cell assemblies are shown. Lines depict median (black) and mean (red) weights.
(C) Number of HC neurons within each cell assembly during Run (n = 82 assemblies).
(D) Cofiring (left) and place field similarity (right) of HC neuronal pairs belonging to a cell assembly are significantly higher than those of pairs of non-HC and HC-non-HC neurons.
(E) Millisecond-timescale activation of cell assemblies within frames increases from Pre- (n = 38,220 frames) to Post-Run sleep (n = 17,367 frames). (Inset) Average activation of cell assemblies at different sequence scores of trajectory sequences is shown.
(F) Proportion of significant cell assemblies activated within a frame increases from Pre- (n = 38,220) to Post-Run sleep frames (n = 17,367).
(G) Temporal order of cell assembly sequences is similar during Pre- and Post-Run sleep.
(H) Within-cell assembly firing rate of HC neurons (n = 208 neurons) increases from Pre-Run to Post-Run sleep. (Inset) Firing of HC neurons at increasing thresholds of activation strengths is shown.
(I) Proportion of HC neurons activated within a significant cell assembly activity increases from Pre- (n = 62,055 events) to Post-Run sleep (n = 31,376 events). (Inset) Distribution of differences in cell assembly activation from Pre- to Post-Run sleep is shown.
(J) Tuning of HC neurons to their respective cell assemblies increases from Pre- (n = 50,284 events) to Post-Run sleep (n = 26,632 events).
(K) Dispersion of spikes of HC neurons outside their respective cell assemblies decreases from Pre- (n = 91,058 events) to Post-Run sleep (n = 41,840 events). Note that only spikes outside the cell assembly activation epoch were considered.
(L) Cell assembly activation after equalizing firing rates and rate correlations is higher in Post- (ReplayEF) compared to Pre-Run sleep (PreplayEF). (Inset) Graphical representation of the dominant contribution of changes in cell assembly strength to improved replay is shown.
For (D)–(L): ***p < 0.001, ns = not significant. Data are represented as mean ± SEM.
