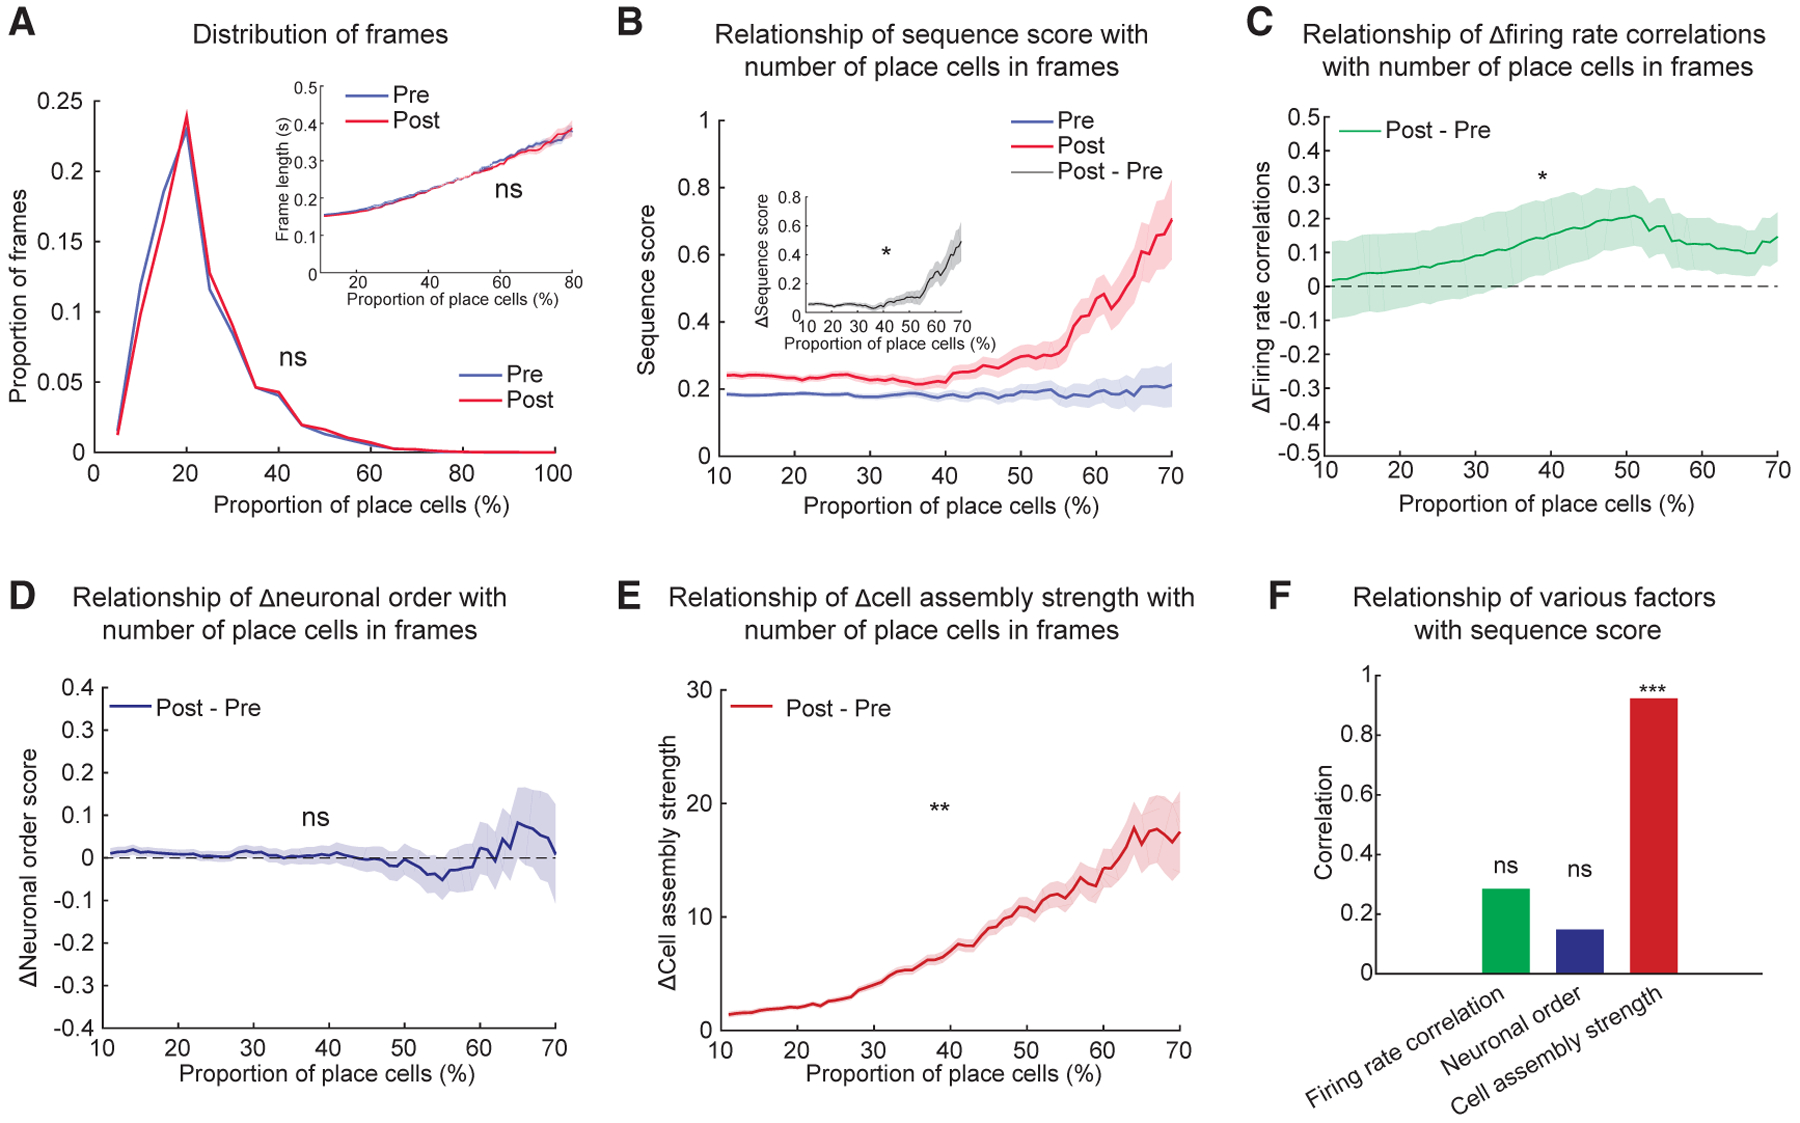
Figure 6. Preferred Improvement in Trajectory Representation in Post-Run Sleep Frames with More Participating Place Cells Is Related to Increases in Cell Assembly Content, but Not Firing Rate or Neuronal Order.

(A) Distribution of frames in Pre- and Post-Run sleep as a function of proportion of place cells active within frames. (Inset) Frames where more place cells are active have longer duration.
(B) Sequence scores in Pre- and Post-Run sleep as a function of proportion on place cells in frames. (Inset) Difference in sequence scores between Post- and Pre-Run sleep as a function of proportion of place cells in frames is shown.
(C–E) Difference in firing rate correlations (C), neuronal order (D), and cell assembly strength (E) between Post- and Pre-Run sleep as a function of proportion of place cells in frames.
(F) Correlations of the difference between firing rate correlations (green, from C), neuronal order (blue, from D), and cell assembly strength (red, from E) with the difference in sequence score from (B) inset between Post- and Pre-Run sleep as a function of proportion of place cells in sleep frames. Data in (B) inset and (C)–(E) are presented as difference in means ± SE of the difference in means.
*p < 0.05, **p < 0.01, ***p < 0.001, ns = not significant.
