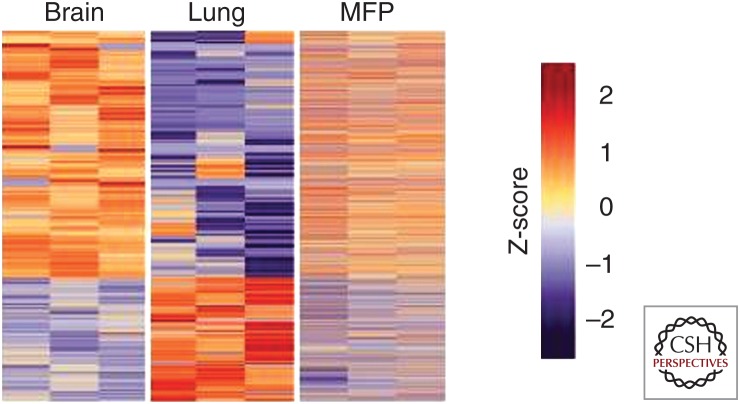
Figure 1.
Heatmap representation of differentially expressed genes identified by Flura-seq in MDA231 cells. Cells residing in the brain, lung, or mammary fat pad (MFP), compared with the expression of these genes in the third organ. (Reproduced from Figure 4 in Basnet et al. 2019, under the Creative Commons Attribution 4.0 International Public License [CC BY 4.0; see creativecommons.org/licenses/by/4.0/].)

