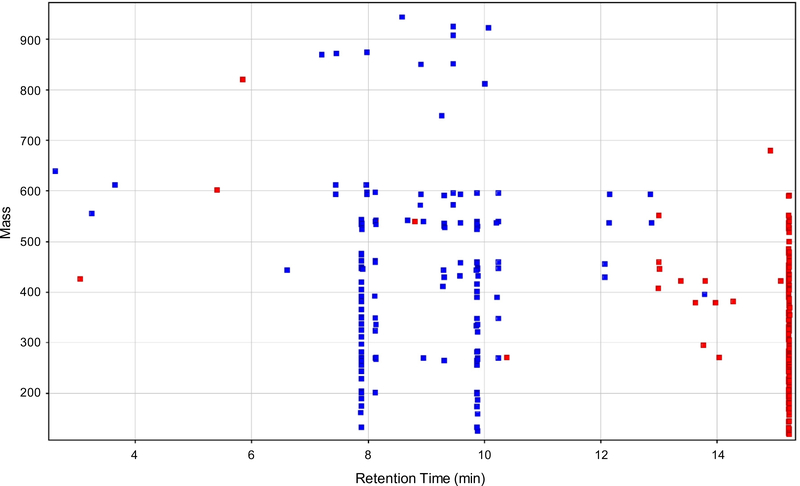
Fig. 2.
Retention time versus mass plot of significantly different non-polar compounds detected in the tomato juices (P < 0.05; fold change >2) showing the compound clusters (“metabolite streaks”) in the data. Red colored compounds were more abundant in the red tomato juice, while blue colored compounds were more abundant in the tangerine tomato juice.

