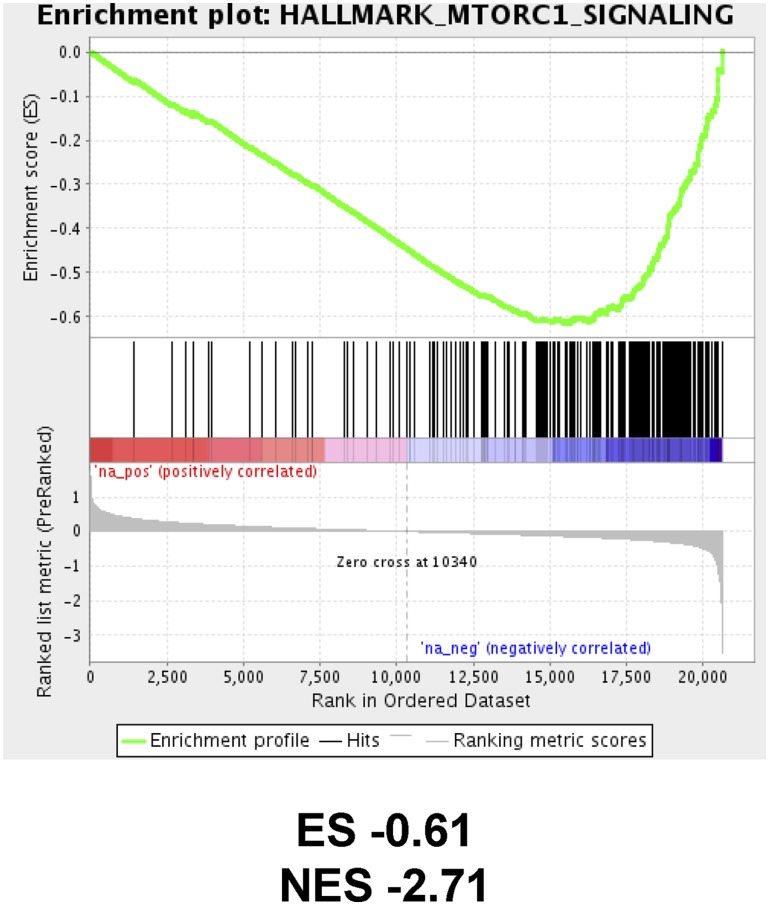
Figure 7. Suppression of mTOR signaling in breast cancer patients treated with abemaciclib.
GSEA enrichment plot for mTOR signature following two weeks of abemaciclib monotherapy treatment (early vs baseline) in the neoMONARCH clinical trial. Nominal p < 0.01, FDR q < 0.01. ES, enrichment score; NES, normalized enrichment score; FDR, false discovery rate.

