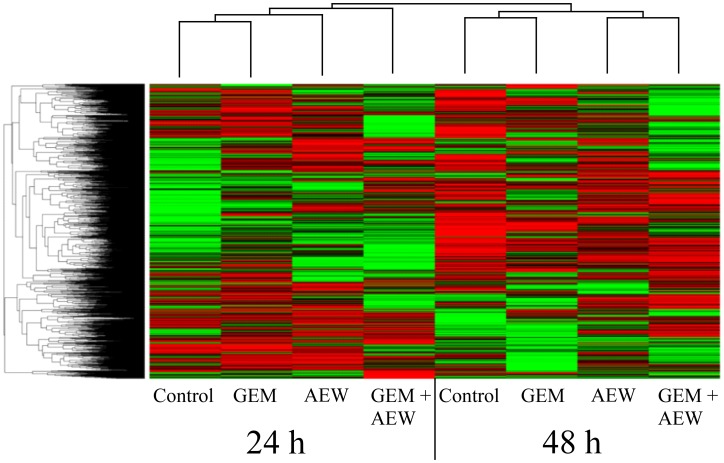
Figure 6. Classification of protein expression by clusters.
Heatmap and dendrograms were constructed by using MATLAB’s clustergram function. Rows and columns represent protein types and samples at 24 and 48 h. The row tree represents proteins and the column tree represents the treatments. The colors in the heat table represent the intensities of the underlying protein expression. The data has been normalized across all samples for each protein, so that the mean is 0 and the standard deviation is 1. The heatmap color key is: red - value higher than average, green - value lower than average, black - value equal to the average value and gray - cells in the input table that did not have values in the first place. GEM, gemcitabine; AEW, AEW541; GEM+AEW, combined treatment.

