
Figure 3.
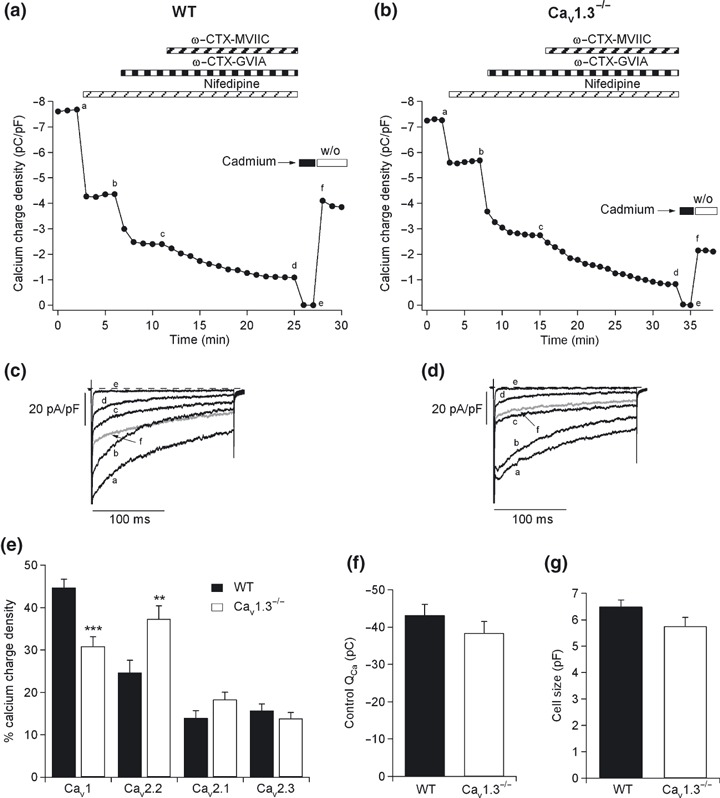
Cav1 channel deletion compensated by the increased expression of other Cav channel types. Pharmacological dissection of Ca2+ channels in mouse chromaffin cells from WT and Cav1.3−/− cells. (a and b) Time course of the Ca2+ charge density obtained after sequentially and cumulatively adding the different Ca2+ channel blockers, in WT and Cav1.3−/− cells, respectively: 3 μM nifedipine was used to block Cav1 channels, 1 μM ω‐CTX‐GVIA to block Cav2.2 channels, 3 μM ω‐CTX‐MVIIC to block Cav2.1 channels, and 200 μM Cd2+ to block the residual Ca2+ current. (c and d) Original traces of the Ca2+ currents recorded at the stationary stage using each Ca2+ channel blocker (corresponding to points a–f in panels 3a and b, where a: control, b: after 3 μM nifedipine perfusion, c: after 3 μM nifedipine and 1 μM ω‐CTX‐GVIA perfusion and d: after 3 μM nifedipine, ω‐CTX‐GVIA and 3 μM ω‐CTX‐MVIIC perfusion). (e) Ca2+ charge density of the different Ca2+ channel types for WT (black columns) and Cav1.3−/− cells (white columns), respectively. (f) Total Ca2+ charge obtained under control conditions for WT (black column) and Cav1.3−/− cells (white column). (g) Sizes of chromaffin cells obtained from WT (black column) and Cav1.3−/− mice (white column). Experiments were performed on nine paired cultures of WT (n = 18 cells) and Cav1.3−/− cells (n = 17 cells), using 1–2 mice of each strain. Bars represent means ± SEM. **p < 0.01; ***p < 0.001, versus the percentage of the same channel in the other mouse strain.