
Figure 5.
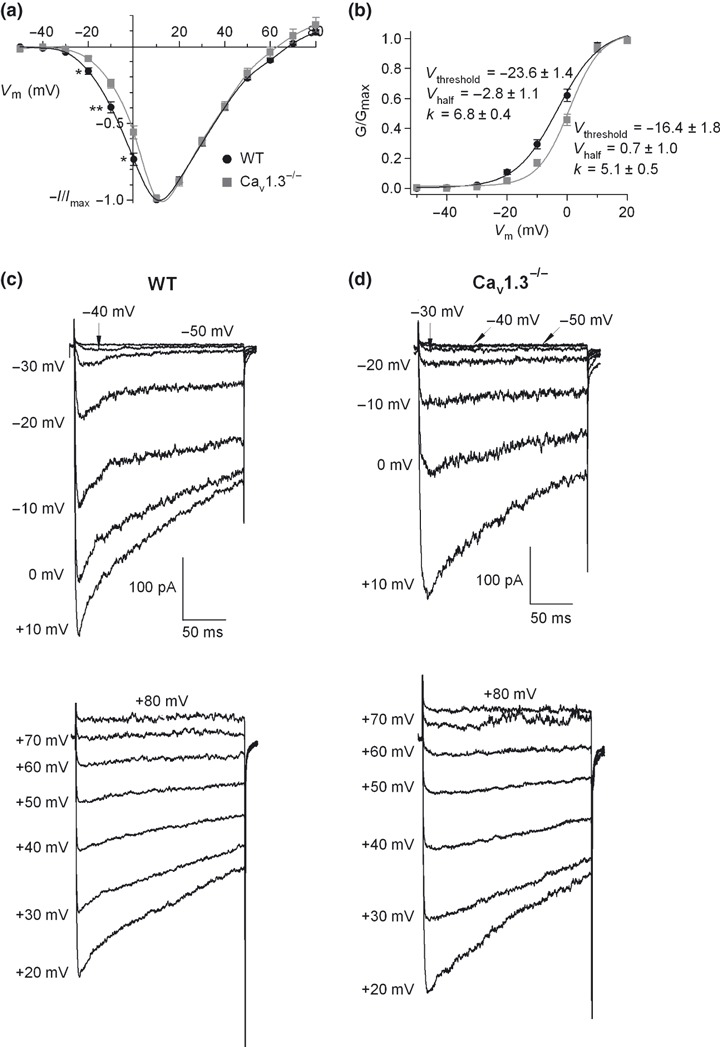
Voltage dependent activation of Ca2+ channels. (a) I–V curves obtained under control conditions in WT and Cav1.3−/− cells (n = 8–12). 200 ms square‐step depolarizing pulses at increasing potentials (voltage increments of 10 mV), from −50 mV to 80 mV, were applied every 1 min. Data were obtained from four paired cultures of WT and Cav1.3−/− cells, using 1–2 mice from each strain and normalized as the percentage of current in control conditions at 10 mV, plotted as the mean ± SEM. *p < 0.05; **p < 0.01. (b) Averaged and superimposed smooth‐curve Boltzmann fittings obtained from the peak current‐voltage relations in panel a, plotted for WT and Cav1.3−/− cells, respectively. (c and d) Original recordings of Ca2+ currents obtained under control conditions for WT and Cav1.3−/− cells, respectively, at the different voltages.