
Figure 6.
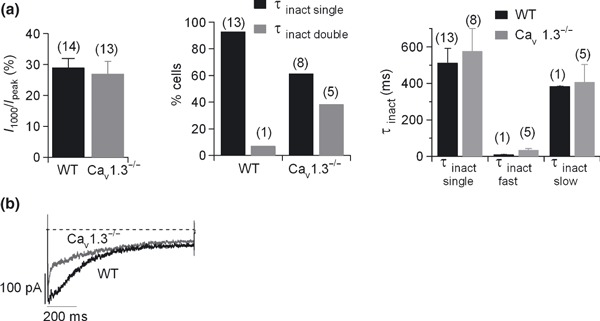
Kinetics of the Cav1 channel subtypes. One‐second square‐step depolarizing pulses were applied at −10 mV every 5 min. (a) Inactivation kinetics. Left, Ca2+ current remaining at the end of a 1‐s pulse expressed as a percentage of the peak current (I 1000/I peak) in WT (black column) and Cav1.3−/− cells (grey column); middle, percentage of cells whose inactivation kinetics could be well fitted to a single (τinact single, black columns) or to a double (τinact double, grey columns) exponential function in WT and Cav1.3−/−; right, the average τinact single yielded by the single exponential fitting, and τinact double, which exhibited two components, a fast component (τinact fast) and a slow component (τinact slow), were plotted for WT and Cav1.3−/− cells (black and grey columns, respectively). (b) Original traces of the Cav1 channel currents recorded in WT and Cav1.3−/−cells were averaged, superimposed and scaled to the peak WT Cav1 channel current. Number of cells indicated in parentheses. Data were obtained in three paired cultures of WT and Cav1.3−/− cells, using two mice of each strain.