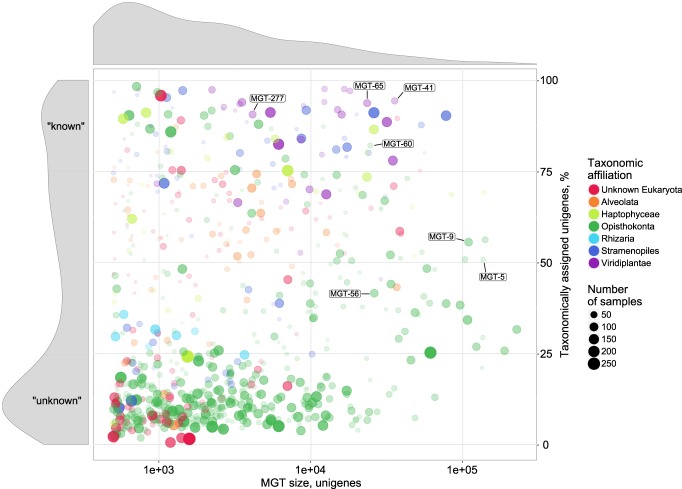
Figure 2.
A visual representation of the major MGT statistics including the MGT size (represented by the number of unigenes, x-axis) and the fraction of taxonomically assigned unigenes (y-axis). The circle size and its opacity represent the number of samples in which a given MGT was detected. Taxonomic affiliation of the MGTs to major eukaryotic lineages is color-coded. Size distribution of MGTs based on the number of unigenes is displayed on top of the main figure. Distribution of taxonomically assigned unigenes among MGTs is presented on the left-hand side panel of the figure. “Known” and “unknown” sections of the panel indicate the MGTs comprising >75% and <25% of taxonomically assigned unigenes, respectively. Highlighted MGTs were used for the biological validation of the MGT collection (see Results for more detail); Bathycoccus prasinos—MGT-41, MGT-65, MGT-277; Oithona nana—MGT-5, MGT-9, MGT-56, MGT-60.

