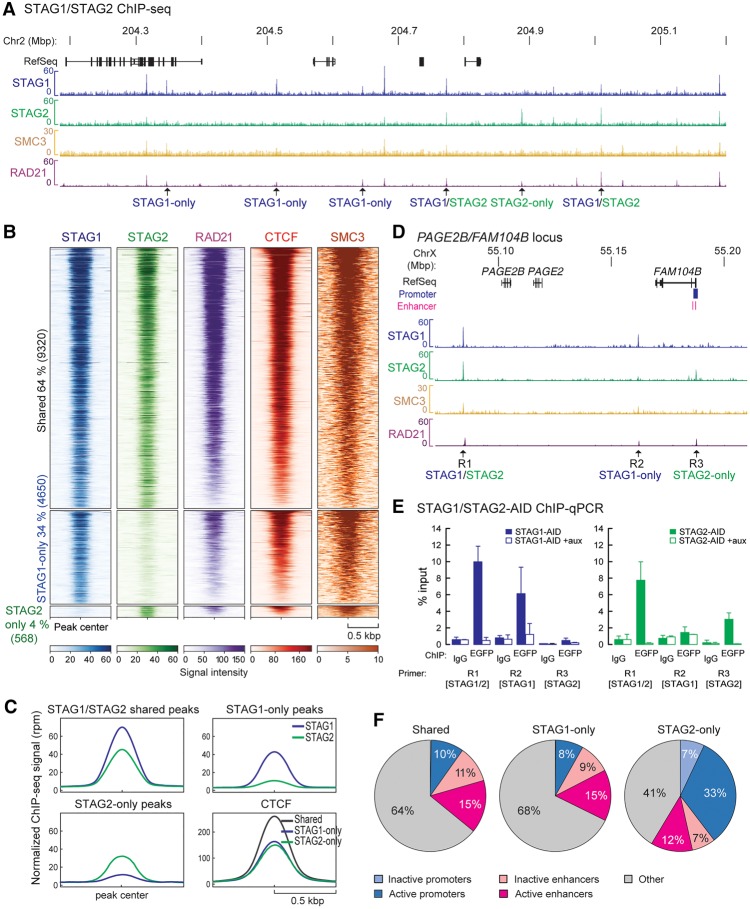
Figure 2.
STAG1 and STAG2 have overlapping as well as discrete binding positions on chromatin. (A) ChIP-sequencing profiles of STAG1 and STAG2 from STAG1-AID and STAG2-AID cells using anti-EGFP antibodies (merge of two replicates), SMC3 ChIP-sequencing for STAG1-AID cells and published RAD21 ChIP-seq data from RAD21-AID cells (Rao et al. 2017) are displayed. Examples of STAG1-only, STAG2-only, and STAG1/2 shared sites are indicated. (B) Heat maps showing the ChIP-seq signals for STAG1, STAG2, RAD21, CTCF, and SMC3 in common and -only sites. RAD21 and CTCF ChIP-seq data are from Rao et al. (2017). (C) Averaged signal intensity of STAG1, STAG2 and CTCF (Rao et al. 2017) on STAG1/2 common sites and STAG1-/STAG2-only sites. (D) Examples of STAG1 and STAG2 binding sites in the PAGE2B/FAM104B locus that were tested in (E) by ChIP-qPCR. (E) Efficiency of auxin-mediated degradation was tested by ChIP-qPCR for different STAG1/STAG2 sites. (F) Localization of STAG1/STAG2 common sites or STAG1- or STAG2-only sites to inactive/active promoters or active/inactive enhancers based on the presence of characteristic histone modifications (Supplemental Table S7). The percentage of the sites in the different regions is indicated.

