Figure 3.
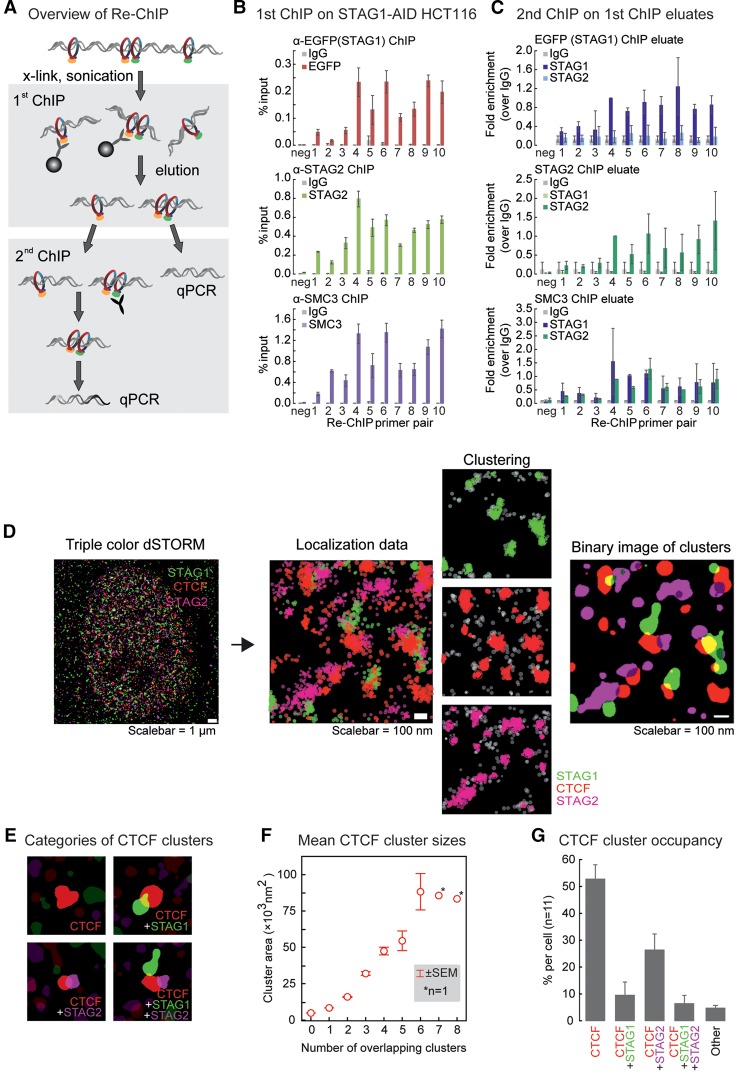
STAG1 and STAG2 do not co-occupy individual binding sites. (A) Overview of the Re-ChIP protocol. Please note that in the first ChIP, the antibodies were crosslinked to the beads, allowing for their complete removal from the eluate. (B) First ChIP in the Re-ChIP protocol performed from STAG1-AID cells with antibodies against EGFP (to precipitate STAG1), or STAG2 or against SMC3 as a positive control. For the analysis, qPCR primers for the amplification of one negative and 10 positive cohesin binding sites were used (mean and SD from n = 2). (C) The second ChIP was performed with control IgG, anti-STAG1, and anti-STAG2 antibodies using the eluates from the first ChIP. The same primers as in B were used for the analysis. Data are shown as fold enrichment versus IgG; the replicates are further normalized using the positive site #4 (see Methods; mean and SD from n = 3 for STAG1 and STAG2, n = 2 for SMC3). (D) Analysis pipeline of the dSTORM imaging data. A merged reconstructed triple-color dSTORM image of a single nucleus stained for STAG1 (green), STAG2 (magenta), and CTCF (red) is shown at the left side. For a zoomed region from the same cell, the raw localizations are shown. The result of the kernel density estimation-based clustering algorithm for the individual colors are shown next to it. Not-clustered localizations are depicted in gray. Finally, a binary image of the same region is shown at the right with the clusters for all three proteins represented. (E) Examples of the four most common groups of CTCF cluster with either: none, one STAG1, one STAG2, or both one STAG1 and one STAG2 cluster adhering. (F) The cluster area size (nm2) for CTCF is plotted grouped per number of adherent clusters of STAG1 or STAG2. (G) Frequency of CTCF cluster groups per cell measured for 11 cells. All CTCF clusters falling in other groups are depicted as “Others.” This group contains 18 subgroups, for example, adhering to more than two clusters or two clusters of the same STAG. All error bars show standard error of the mean (± SEM). Note that in Supplemental Figure S7, the same experiment using different secondary antibodies and different fluorophores is shown.

