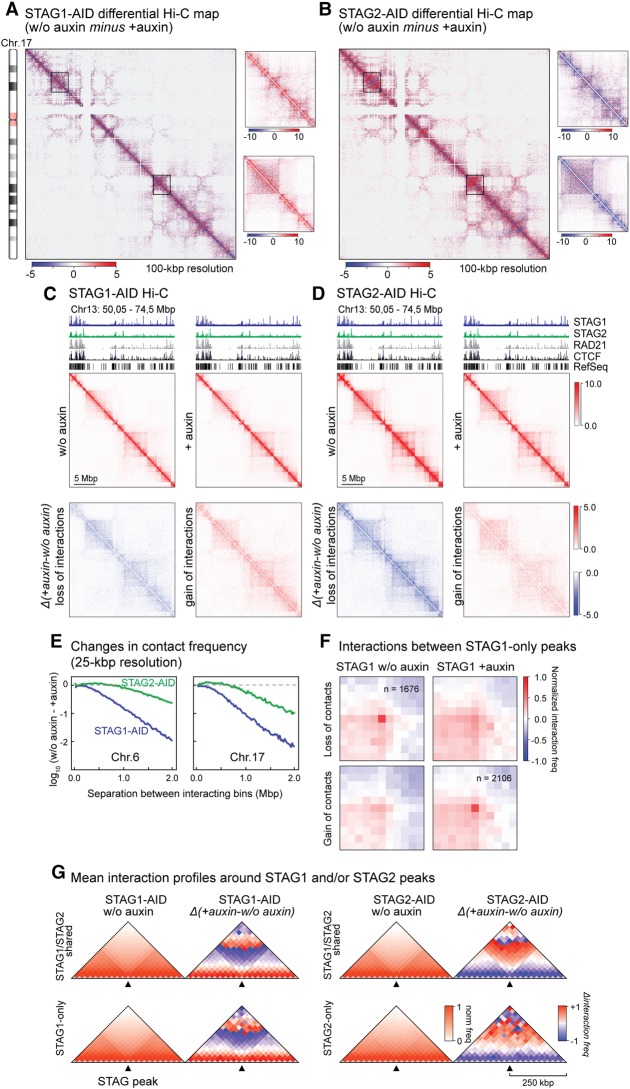
Figure 4.
Hi-C reveals different contributions of STAG1 and STAG2 to higher-order chromatin structure. (A,B) Differential maps of Chromosome 17 illustrating the chromatin contact changes after auxin-mediated degradation of STAG1 (A, STAG1-AID) or STAG2 (B, STAG2-AID). Examples of changes are encircled. Color key = Balanced (Knight-Ruiz) Hi-C contact frequencies. (C,D) Zoom-in for a region of Chromosome 13 into the contact maps for STAG1-AID (C) and STAG2-AID (D) cells. The maps for untreated cells (w/o auxin), treated cells (+auxin), and the differential interaction maps split in loss of interactions (blue) and gain of interactions (red) are shown. (E) Change of chromatin contact frequency relative to the separation of the contacting bins (25 kb) after STAG1 or STAG2 degradation for the examples of Chromosomes 6 and 17. (F) Aggregate peak analysis of STAG1-only peaks showing that a lot of the sites lose their respective contacts after STAG1 degradations while alternative contacts are formed. (G) Insulation plots showing the averaged Hi-C signals for all STAG1/STAG2 shared peaks as well as all STAG1-only and STAG2-only peaks in the untreated maps (w/o auxin). For the same peaks, the averaged differential Hi-C signals in the different maps are shown. The maps are presented with a bin size of 25 kb and 10 bins to the left and right of each binding site.

