Figure 5.
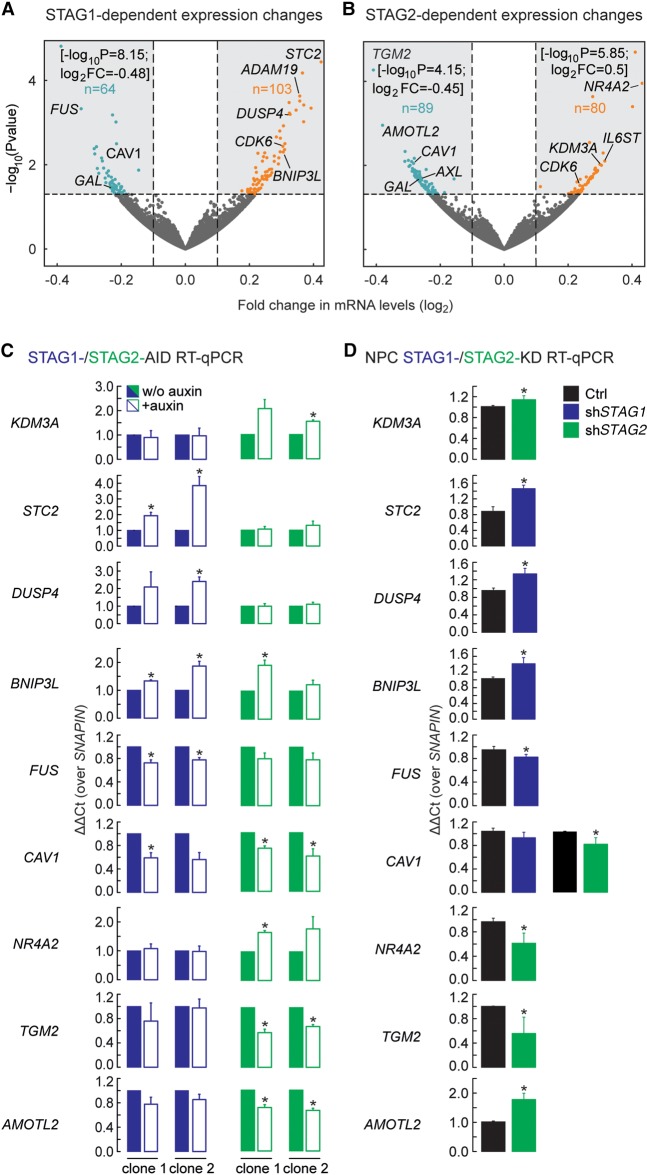
STAG1 or STAG2 regulate different genes. (A,B) Volcano plots representing the transcriptional changes after STAG1 degradation (A) or STAG2 degradation (B). Significantly changing genes are plotted in blue when down-regulated, in orange when up-regulated. Genes that lie outside of the plotted range are indicated with their fold change and P-value. (C) Validation of genes responding to degradation of STAG1 or STAG2 in two independent clones of the respective AID cells by RT-PCR/qPCR. Genes that respond to STAG1 (STC2, DUSP4, BNIP3L, FUS) or STAG2 (KDM3A, NR4A2, TGM2, AMOTL2) or both (CAV1) were tested. (D) Sensitivity of genes to depletion of STAG1 or STAG2 was recapitulated in neural stem cells using siRNA depletion of STAG1 (shSTAG1) and STAG2 (shSTAG2). Mean of n = 3, t-test P-values are indicated, (*) P < 0.05, (**) P < 0.01.

