Figure 1.

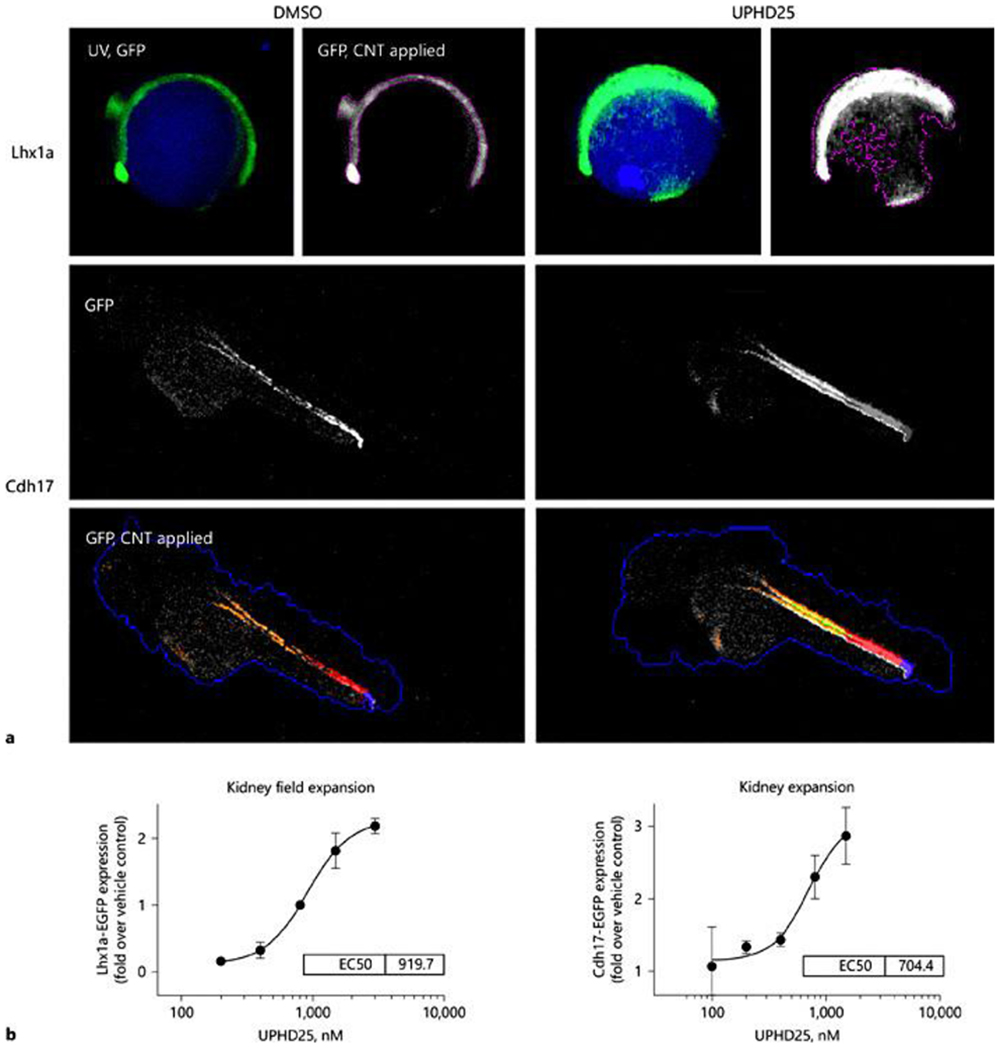
Cognition network technology (CNT) image-based analysis of EGFP-labeled transgenes. a Upper panel: Tg(lhx1a:EGFP)pt303 treated at 3 hpf with vehicle (0.5% DMSO) or UPHD25 (1.5 μM). Images acquired in the UV (DAPI) and green fluorescent protein (GFP) channels after 12 h. A CNT ruleset was applied that detected the whole embryo by auto-fluorescence (UV, GFP) and the transgene as a lower hierarchy sub-object (GFP, CNT applied), permitting transgene-specific measurements of intensity and shape. UPHD25 increases the Lhx1a-EGFP expression and causes characteristic changes in transgene morphology. Lower panel: GFP channel fluorescence micrographs in lateral view of 48 hpf Tg(Cdh17:EGFP)pt305, treated with vehicle or UPHD25 (800 nM). The zebrafish embryonic kidney appears as a pair of tubular structures that converge at the cloaca (triangle). A CNT ruleset was applied that detected the fluorescent kidney (orange). The cloaca was classified based on the brightness and proximity to the zebrafish edge (blue), permitting quantification of Cdh17-EGFP in a defined length tubular segment (red). UPHD25 increases GFP intensity within the embryonic zebrafish kidney. For all panels, rostral is to the left, dorsal pointing up. b Dose-response curves of UPHD25 on kidney progenitor cell expansion using Lhx1a-EGFP and kidney organ size by EGFP-Cdh17 with similar EC50 values for UPHD25 in the 2 models.
