Figure 1.

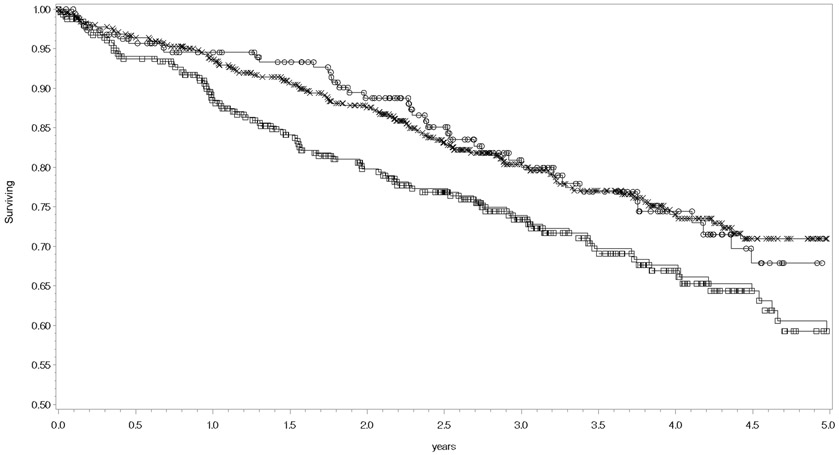
Kaplan-Meier curves for all-cause mortality stratified by rs9909004 genotypes. Censored patients with the T/T genotype are symbolized as squares,, C/T genotype as the letter X, and C/C genotype as circles. The logrank p-value = 0.0189.

Kaplan-Meier curves for all-cause mortality stratified by rs9909004 genotypes. Censored patients with the T/T genotype are symbolized as squares,, C/T genotype as the letter X, and C/C genotype as circles. The logrank p-value = 0.0189.