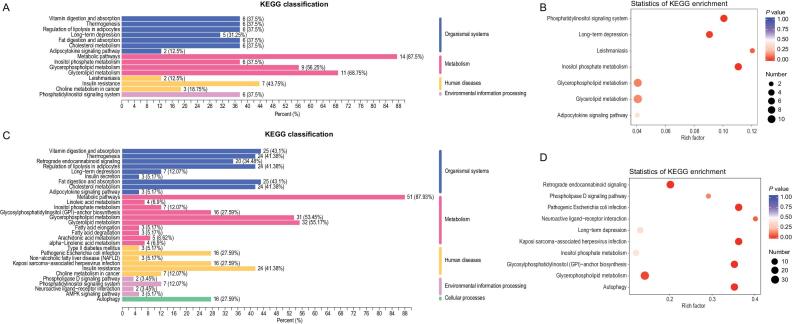
Figure 5.
Lipidome KEGG enrichment analysis of patients with COVID-19. (A,B) KEGG pathway analysis of differentiating lipids shared in all the groups. The color of bubbles represents the value of adjusted P value, and the size of bubbles represents the number of counts (sorted by gene ratio). (C,D) KEGG pathway analysis of differentiating lipids shared unique to the fatal groups.

