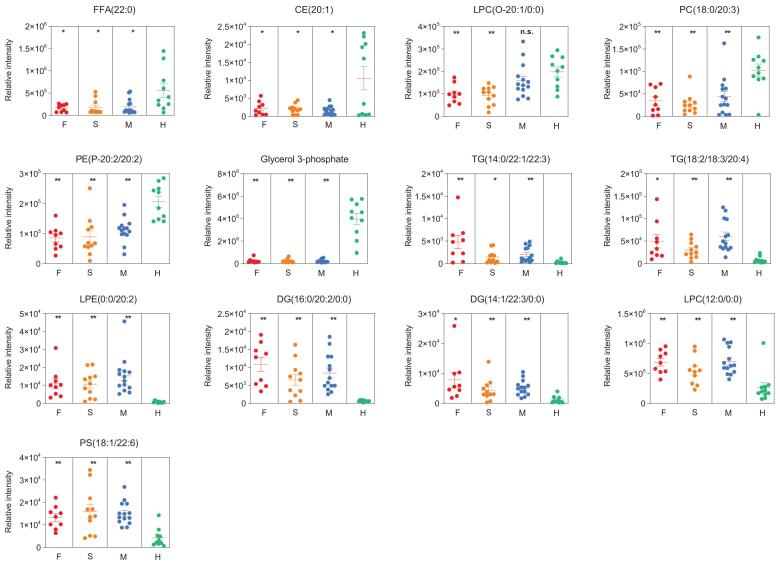
Figure 6.
Potential lipidomic biomarkers of COVID-19, in terms of the relative intensity for each lipid. Each dot represents a patient sample, and each patient group is differently colored as indicated. F, fatalities; S, patients with severe symptoms; M, patients with mild symptoms; H, healthy volunteers. *P < 0.05, **P < 0.01.

