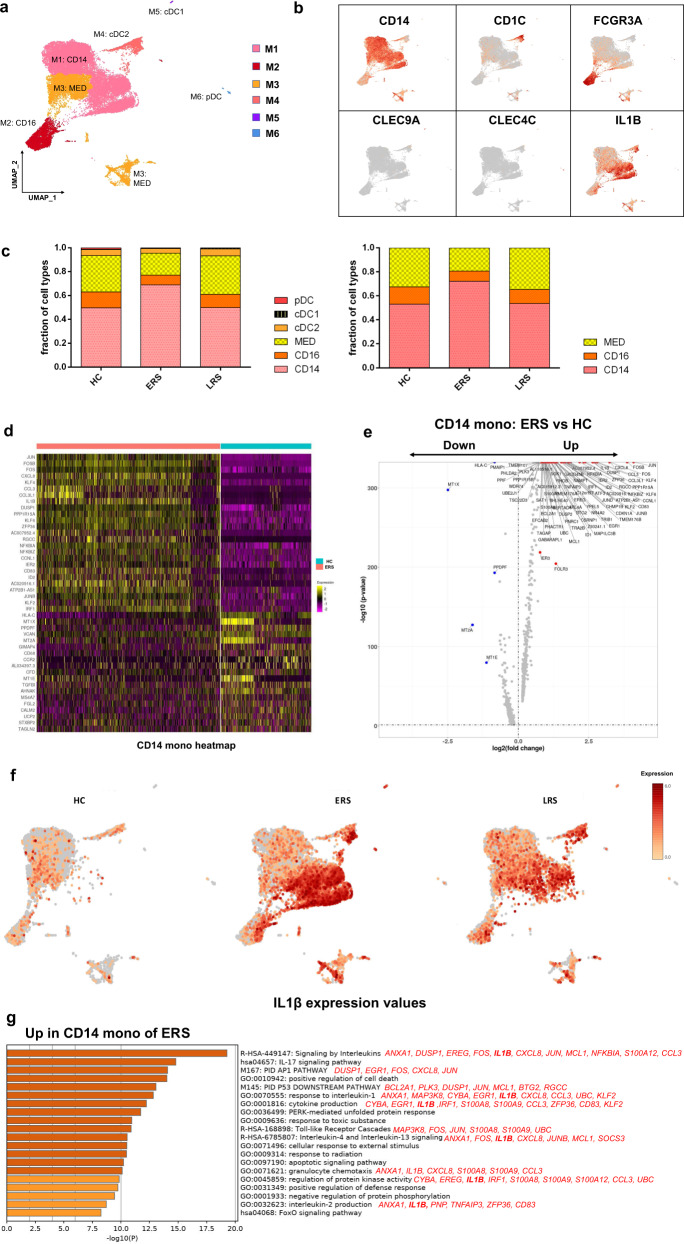
Fig. 3. Myeloid cell subsets and their states in the blood of convalescent patients with COVID-19.
a Six clusters of myeloid cells were displayed according to marker gene expression levels. Uniform manifold approximation and projection (UMAP) presentation of the heterogeneous clusters of peripheral myeloid cells. Classical CD14++ monocytes (M1), non-classical CD16++ (FCGR3A) CD14−/+ monocytes (M2), intermediate CD14++ CD16+ monocytes (M3), CD1C+ cDC2 (M4), CLEC9A+ cDC1 (M5), and pDC (CLEC4C+CD123+) (M6). b The UAMP plot shows subtype-specific marker genes of myeloid cells, includingCD14, FCGR3A, CD1C, CLEC9A, CLEC4C, and IL-1β. c Bar chart of the relative frequencies of the six sub-clusters of myeloid cells and three sub-clusters of monocytes across the HCs and the ERS and LRS patients. d The heatmap shows the top DEGs between COVID-19 patients and HCs in CD14++ monocytes. e Volcano plot of fold change between COVID-19 patients and HCs in CD14++ monocytes. P values were calculated using a paired, two-sided Wilcoxon test and FDR corrected using the Benjamini–Hochberg procedure. f The UAMP plot shows that IL-1β was highly expressed in the ERS patients vs. the LRS patients and HCs in myeloid cells. g GO BP enrichment analysis of the DEGs of CD14++ monocytes upregulated in COVID-19 patients. P value was derived by a hypergeometric test.

