6.

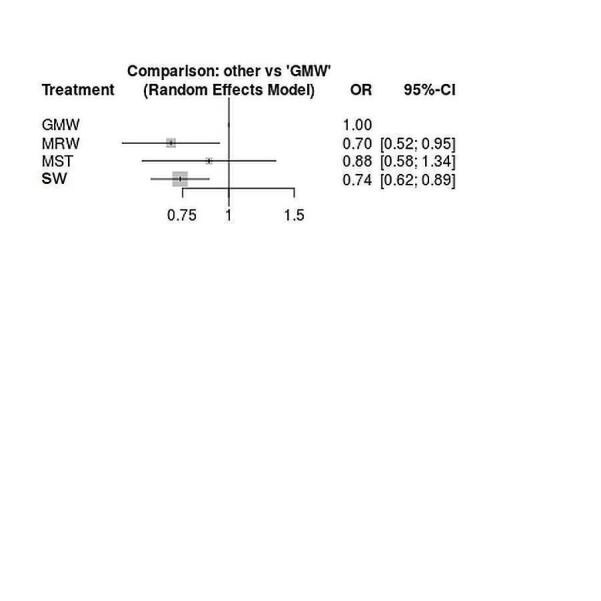
Network meta‐analysis plot for different types or organised care. The outcome is poor outcome at the end of scheduled follow‐up. The treatment column shows the service groups (GMW: general medical ward; MRW: mixed rehabilitation ward; MST: mobile stroke team; SW: stroke ward). The results are the odds ratio (95% confidence interval) for the odds of a poor outcome, with care in a GMW as the reference (OR = 1.0).
